The Lost Coast Trail

Heading south from the Mattole  campground on the Lost Coast Trail

The Lost Coast of California is 80 miles of the most remote ocean front coast in the United States.  A four-ish hour drive up the 101 from San Francisco followed by a 45 minute westward dive down winding mountain roads leads you to Shelter Cover, CA – the southern trailhead for this journey.

California’s Highway 1 snakes up the Pacific coast until it hits the King Mountain Range.  The construction workers decided that the rest of the coast was impassable and gave up trying to forge a path through the mountains.  The “Lost Coast” is this remaining track of unspoiled wilderness area.

In the last few days of June 2012 I flew from Austin to San Jose and headed north to give it a go.  It was an amazing hike.


The Hike

The Lost Coast Trail is 2/3rds beach and gravel hiking along with a third of actual “trail” that occasionally heads up on flats overlooking the beach.  Even though there isn’t much in the way of trail markers its impossible to get lost: if you’re walking south keep the ocean on your right.  Not too hard.

  • 25-ish miles south bound from Mattole back to Shelter Cove
  • A free permit is required – they are self service and available at either trail head.
  • It’s BLM wilderness land so the whole trail is open to camping.  There are a good number of driftwood “shelters” set up along the beach and up on the flats.  Poke around the shelter for snakes before you settle in.
  • Bear canisters are required.  I didn’t see any bears, but was told that they are plentiful – even on the beach.  However, since canisters have been enforced for a while now they aren’t aggressive.
  • Maps: There are some available from BLM, but I grabbed this one from Amazon so I could plan things out.  Planning the trip is half the fun!
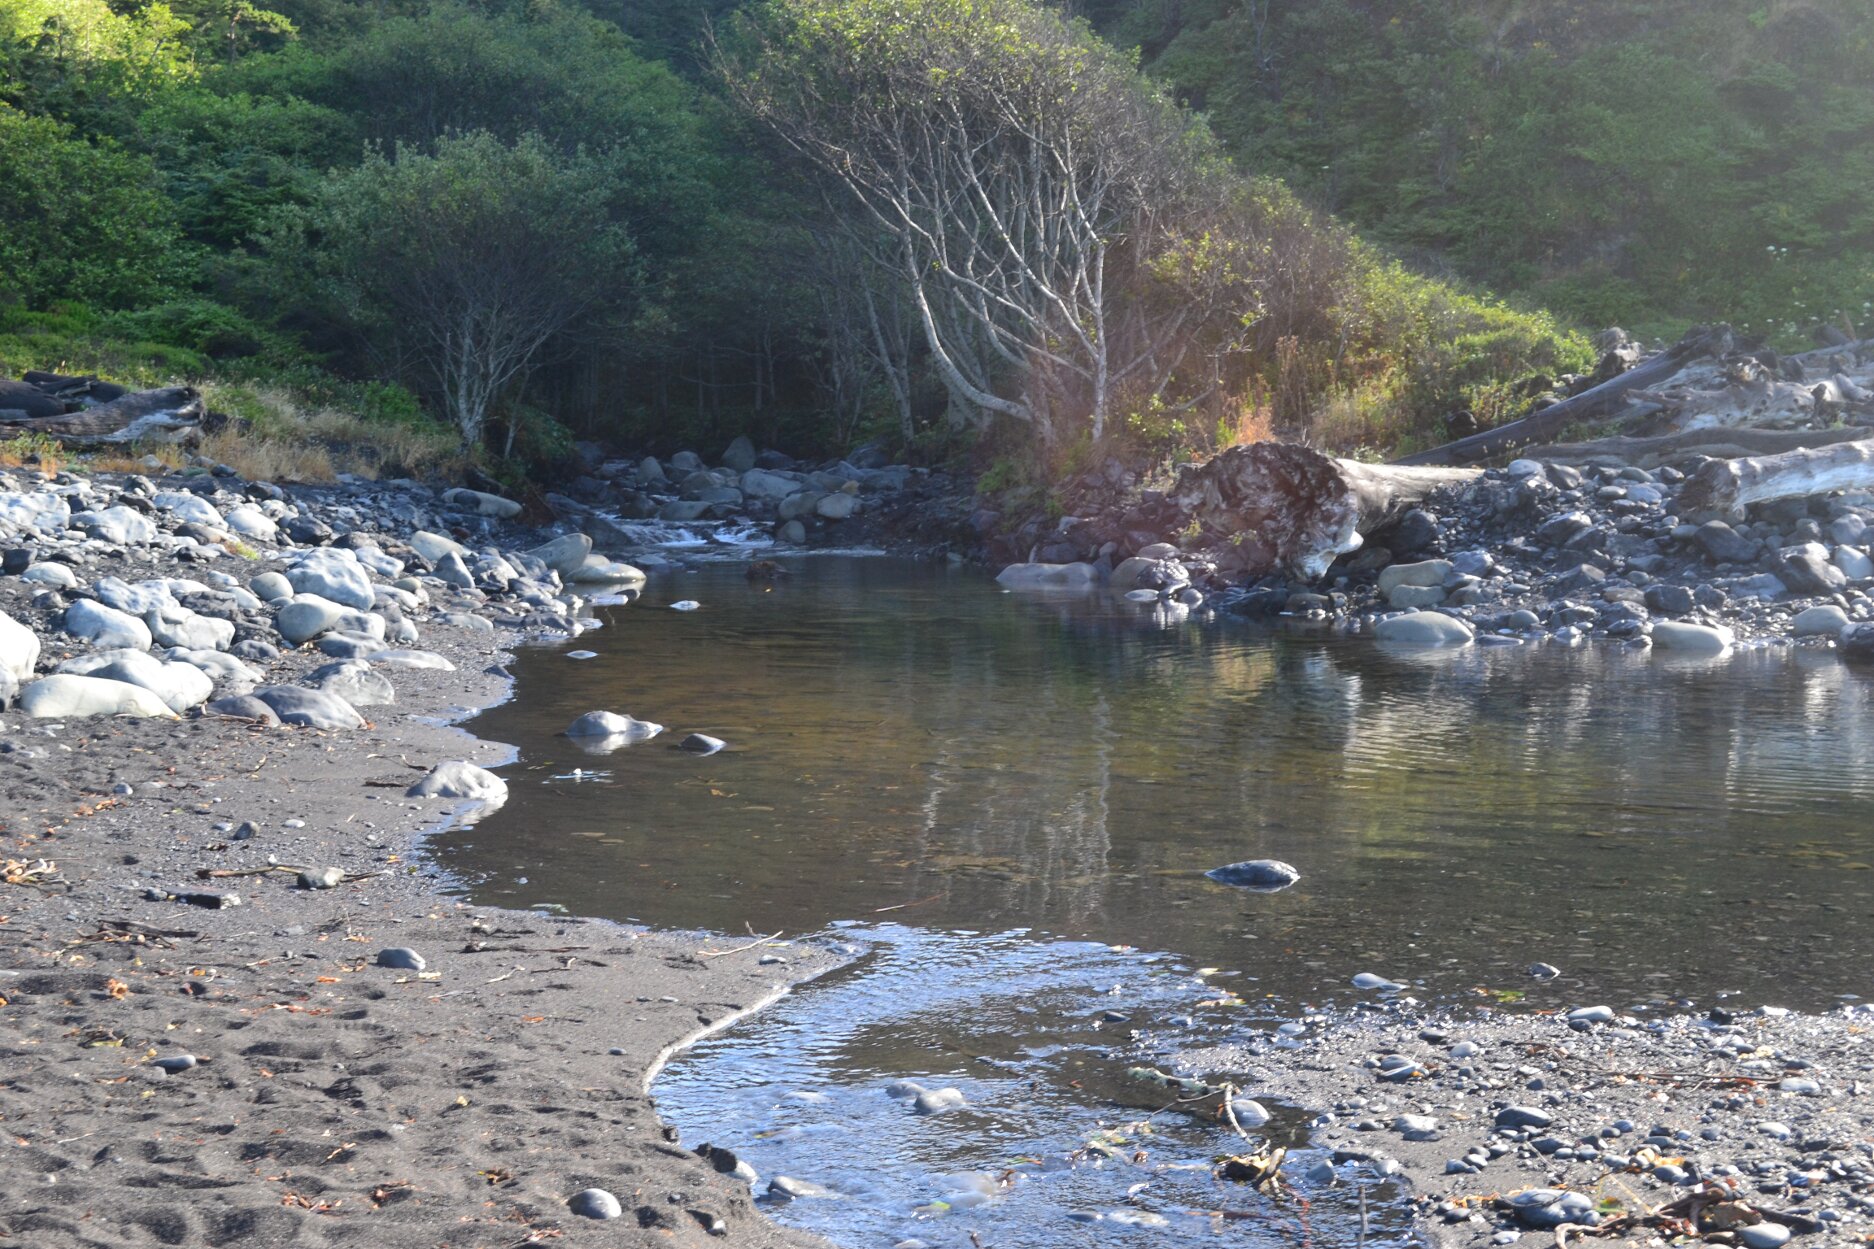
  • Water: There are lots of streams that bring water out of the mountains on to the beach.  Bring your water treatment of choice, but water shouldn’t be a problem.

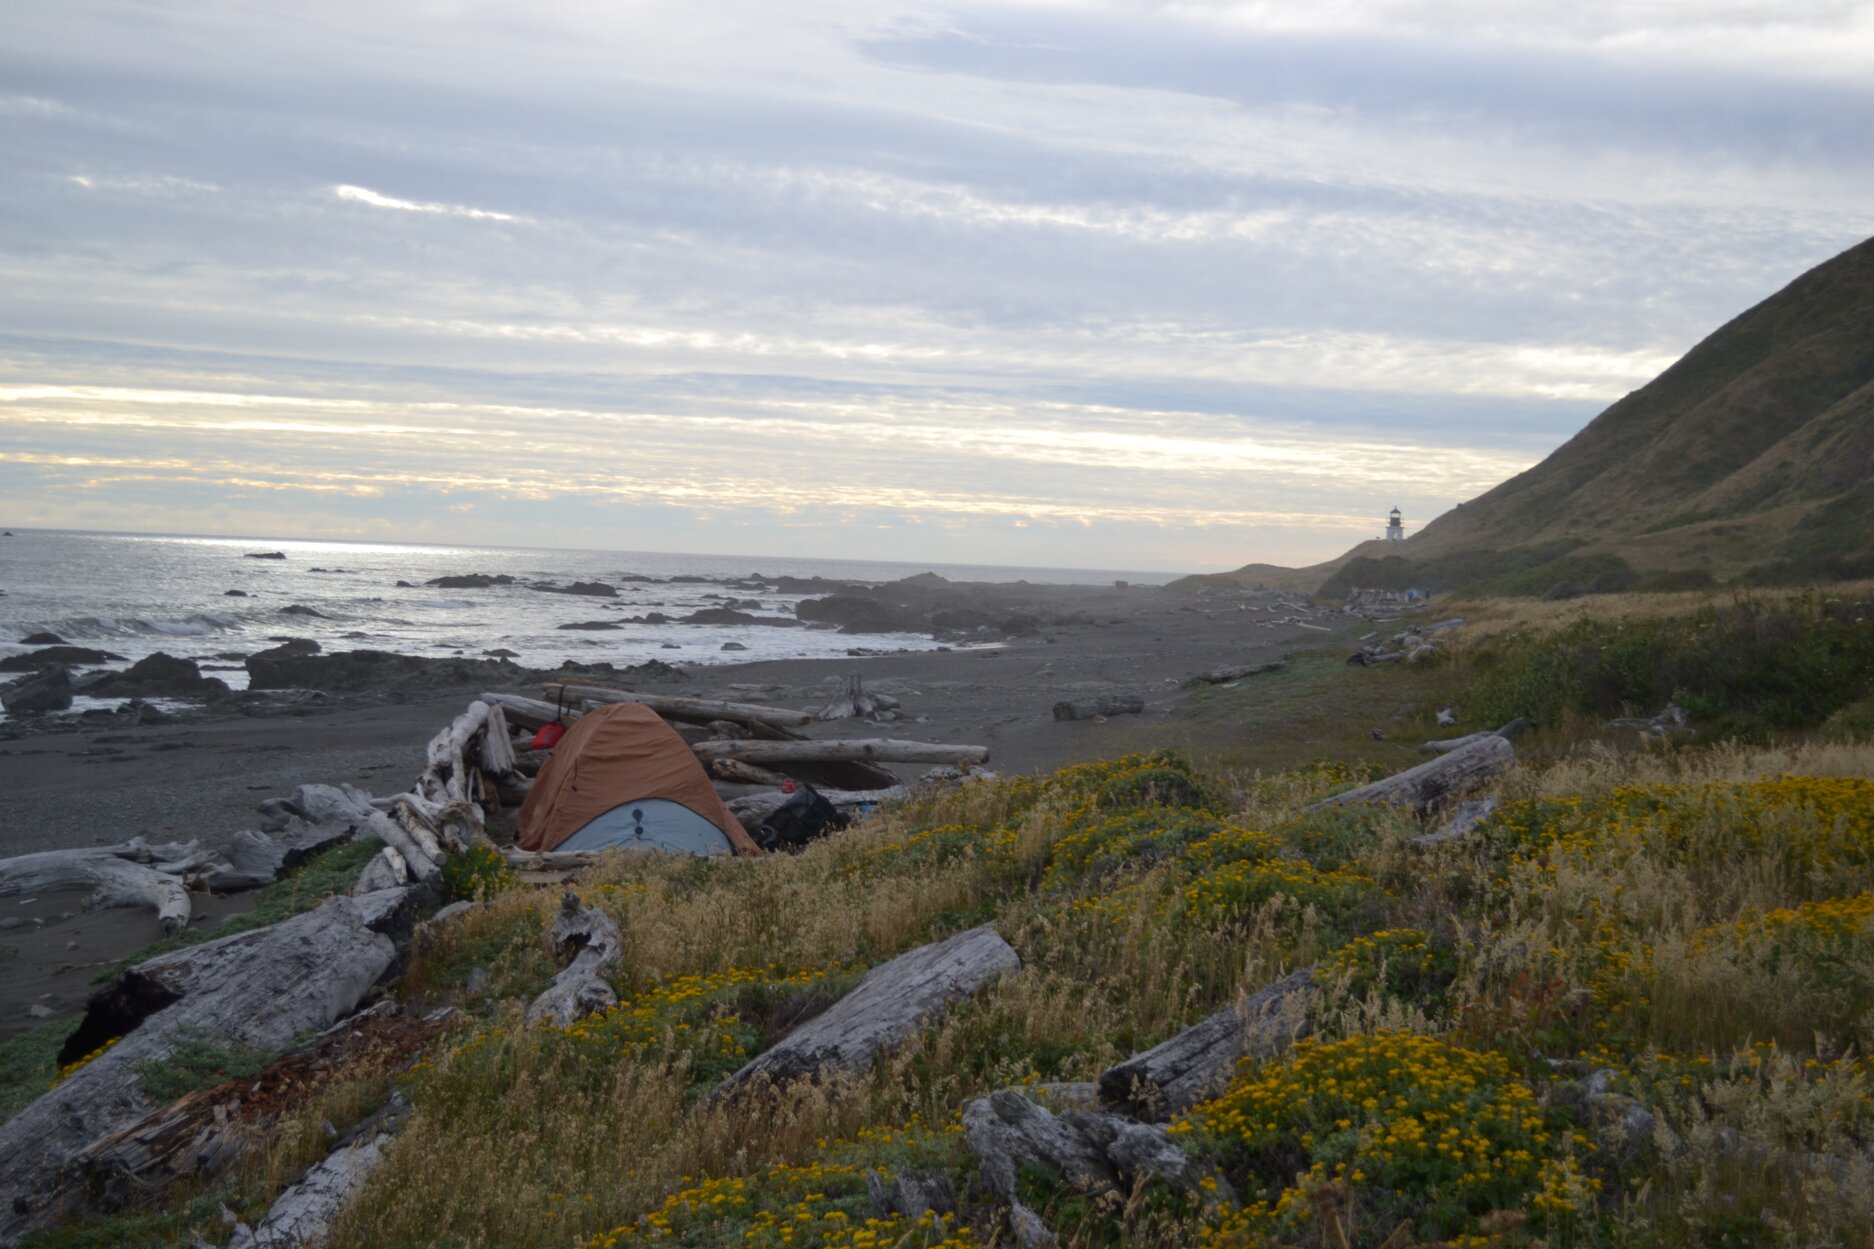
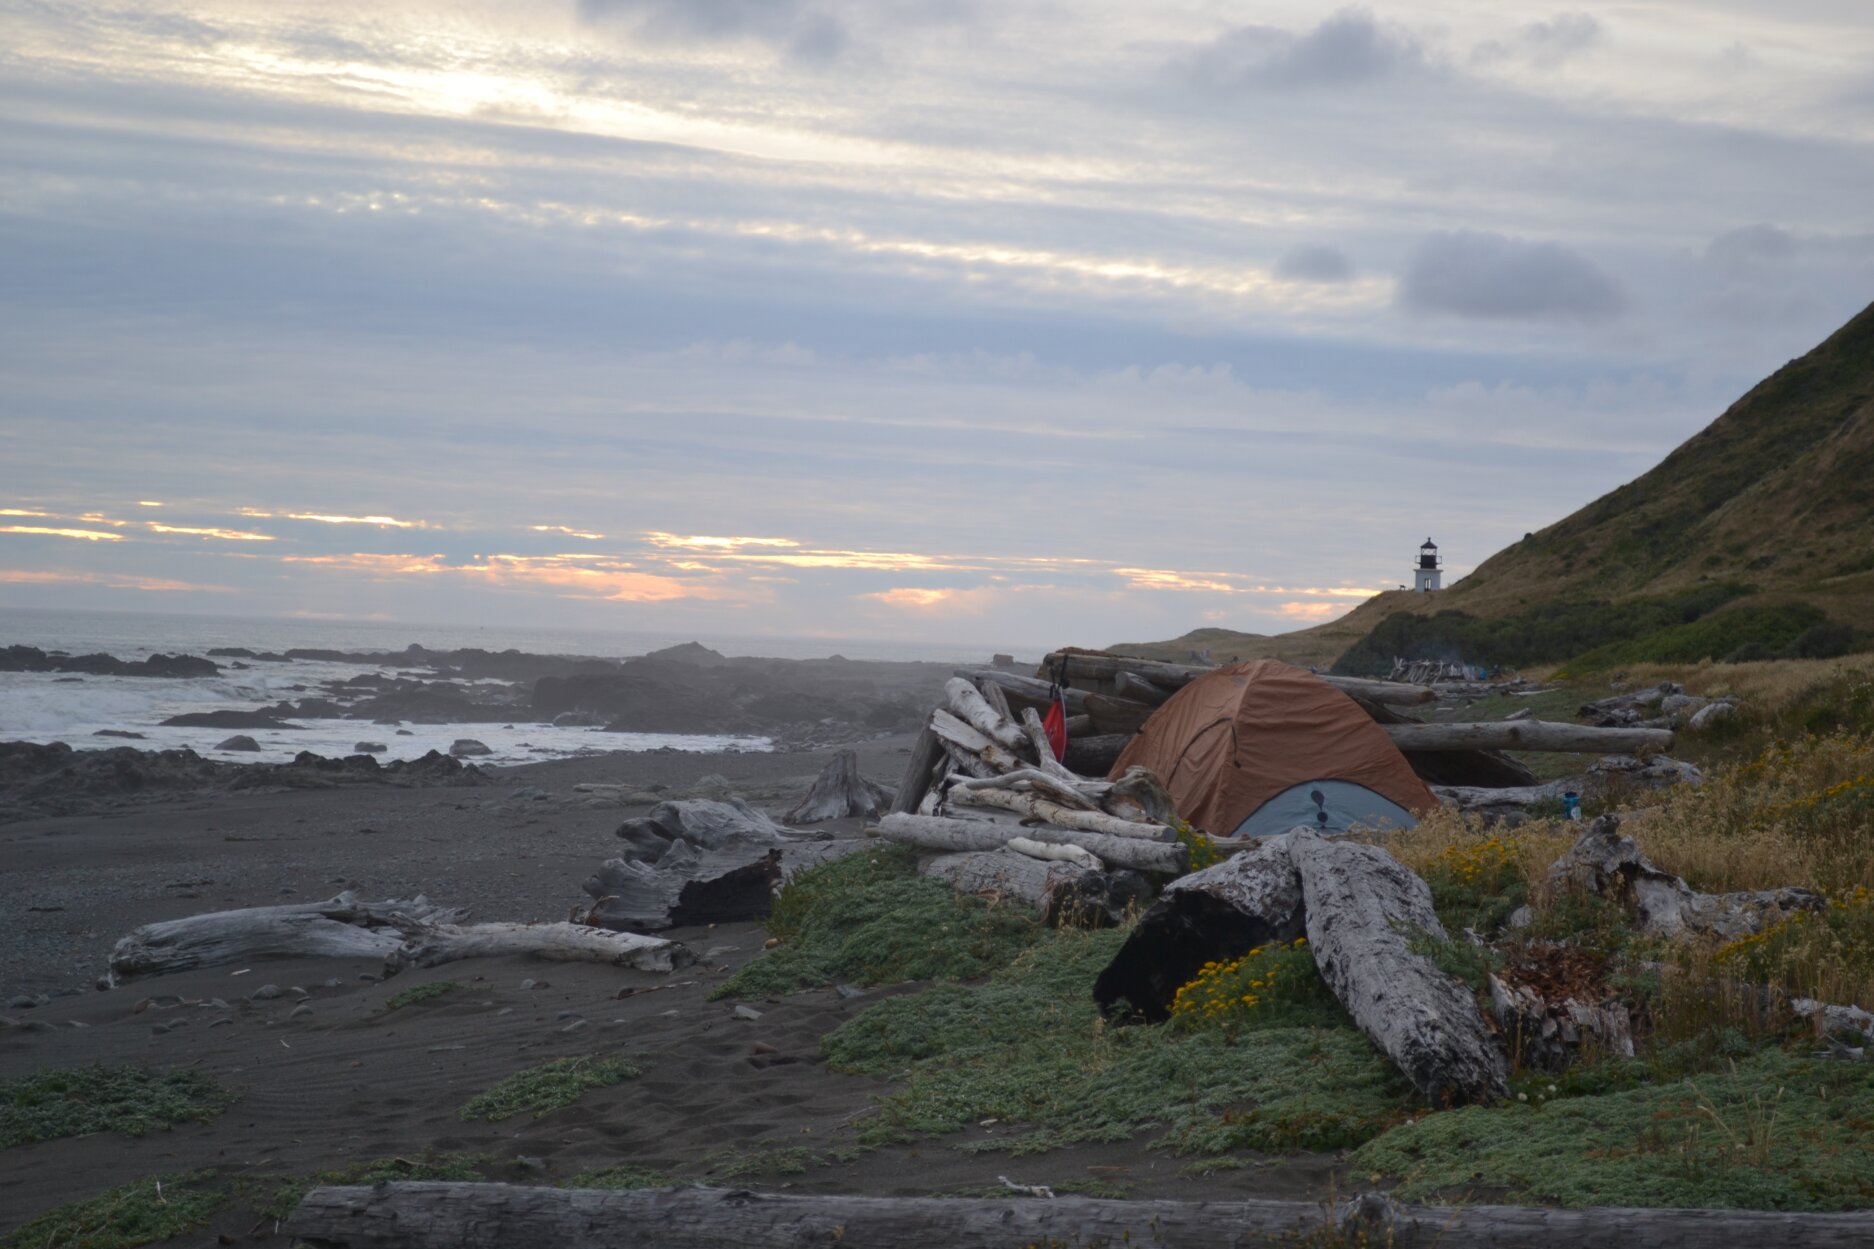
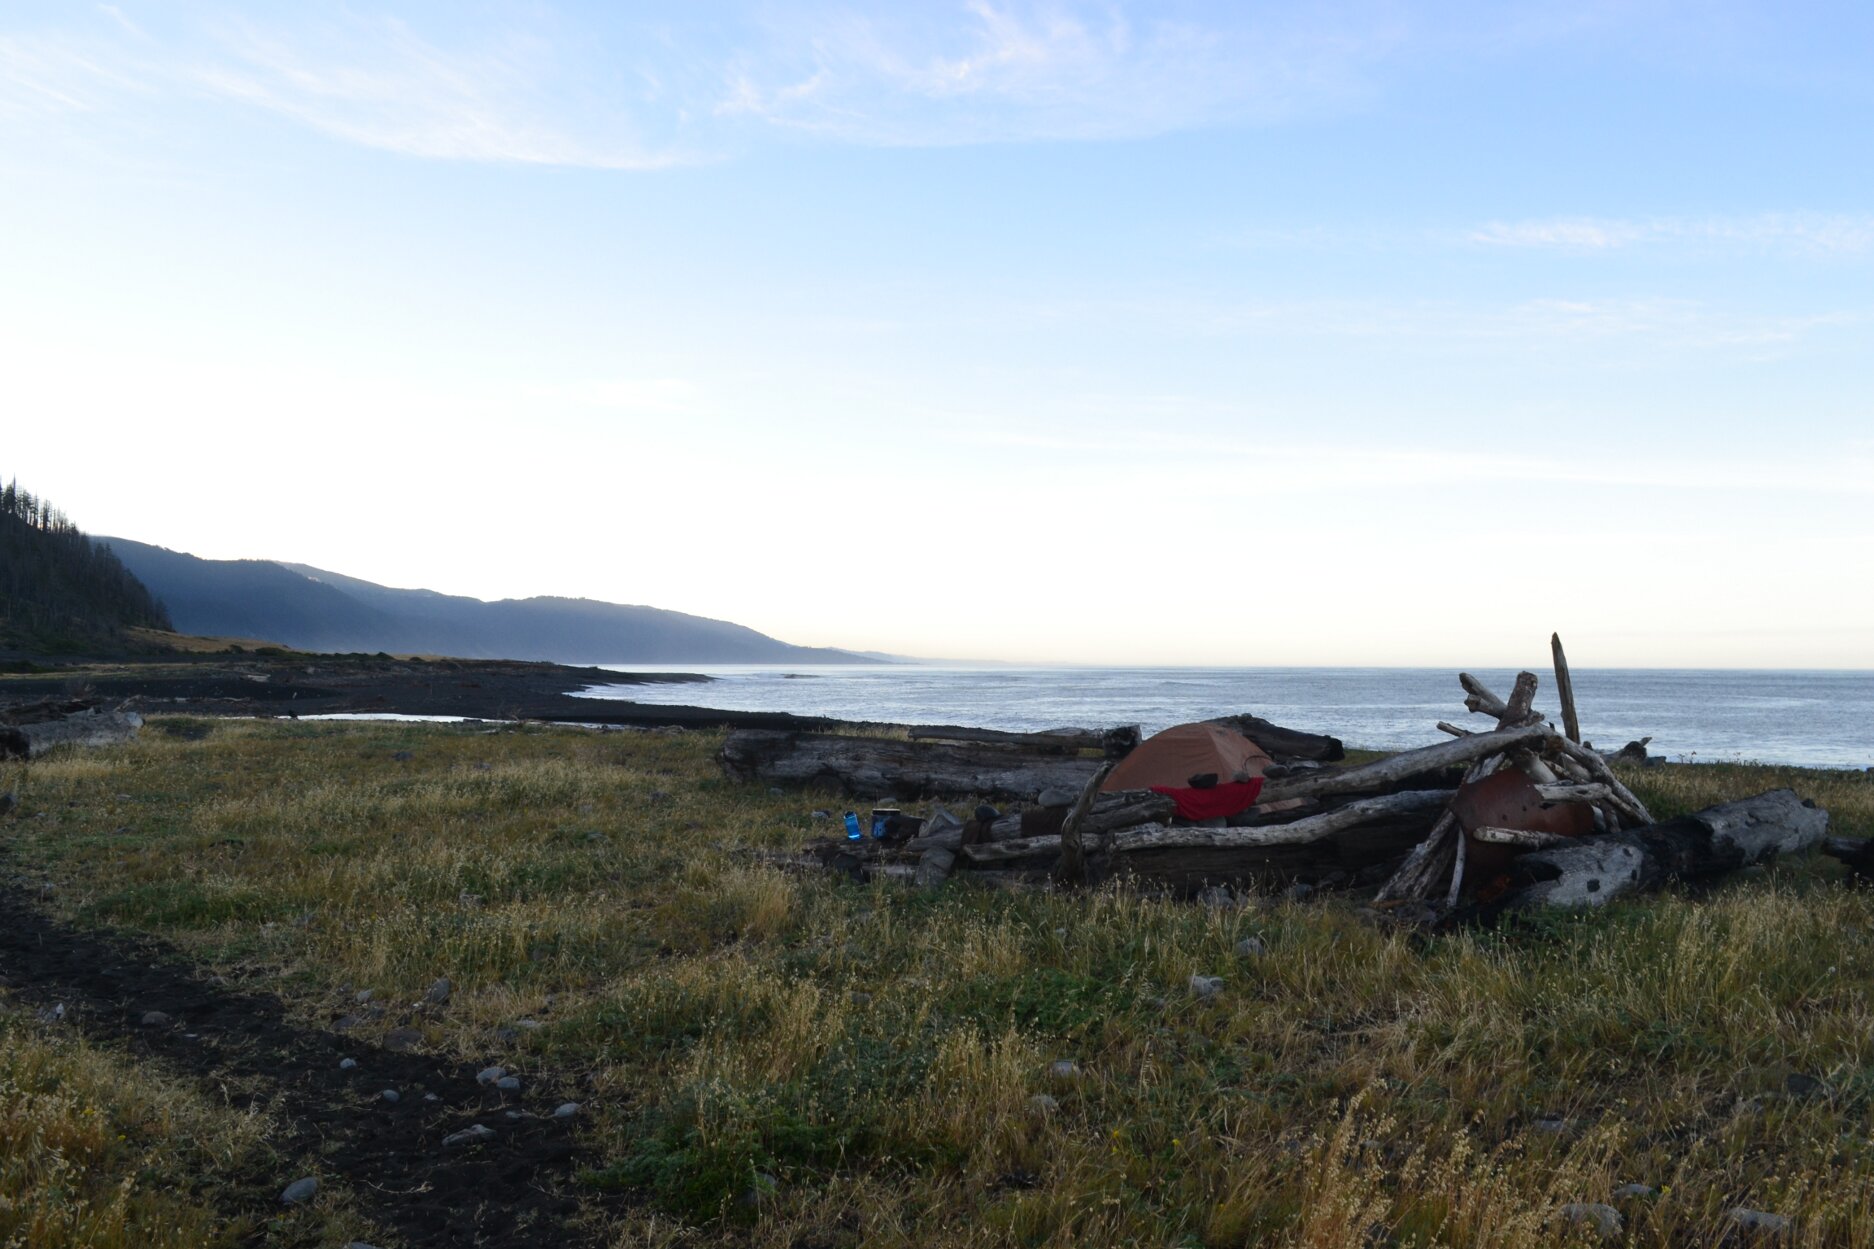
My hike was 3 days and 2 nights.  I started late on day 1 and only put about 4 miles in before setting up camp in a very cool spot just South of the lighthouse.  Day 2 was 13 miles in rain.  Lots and lots of rain.  It was never hard, but it rained from 9am to 3pm steadily.  This area gets almost 120 inches of rain a year so I don’t think that was too unusual a day, even in the summer.  Weather forecasts change quickly so bring some type of rain gear.  Day 3 was a half day hike of the remaining miles back to Shelter Cove.


The Tides

Even though the route is only 25-ish miles long I couldn’t have done it a whole lot faster than the 3 days / 2 nights that I spent on the coast.  There are several sections of the trail that hug right against the ocean and become impassable at high tide.

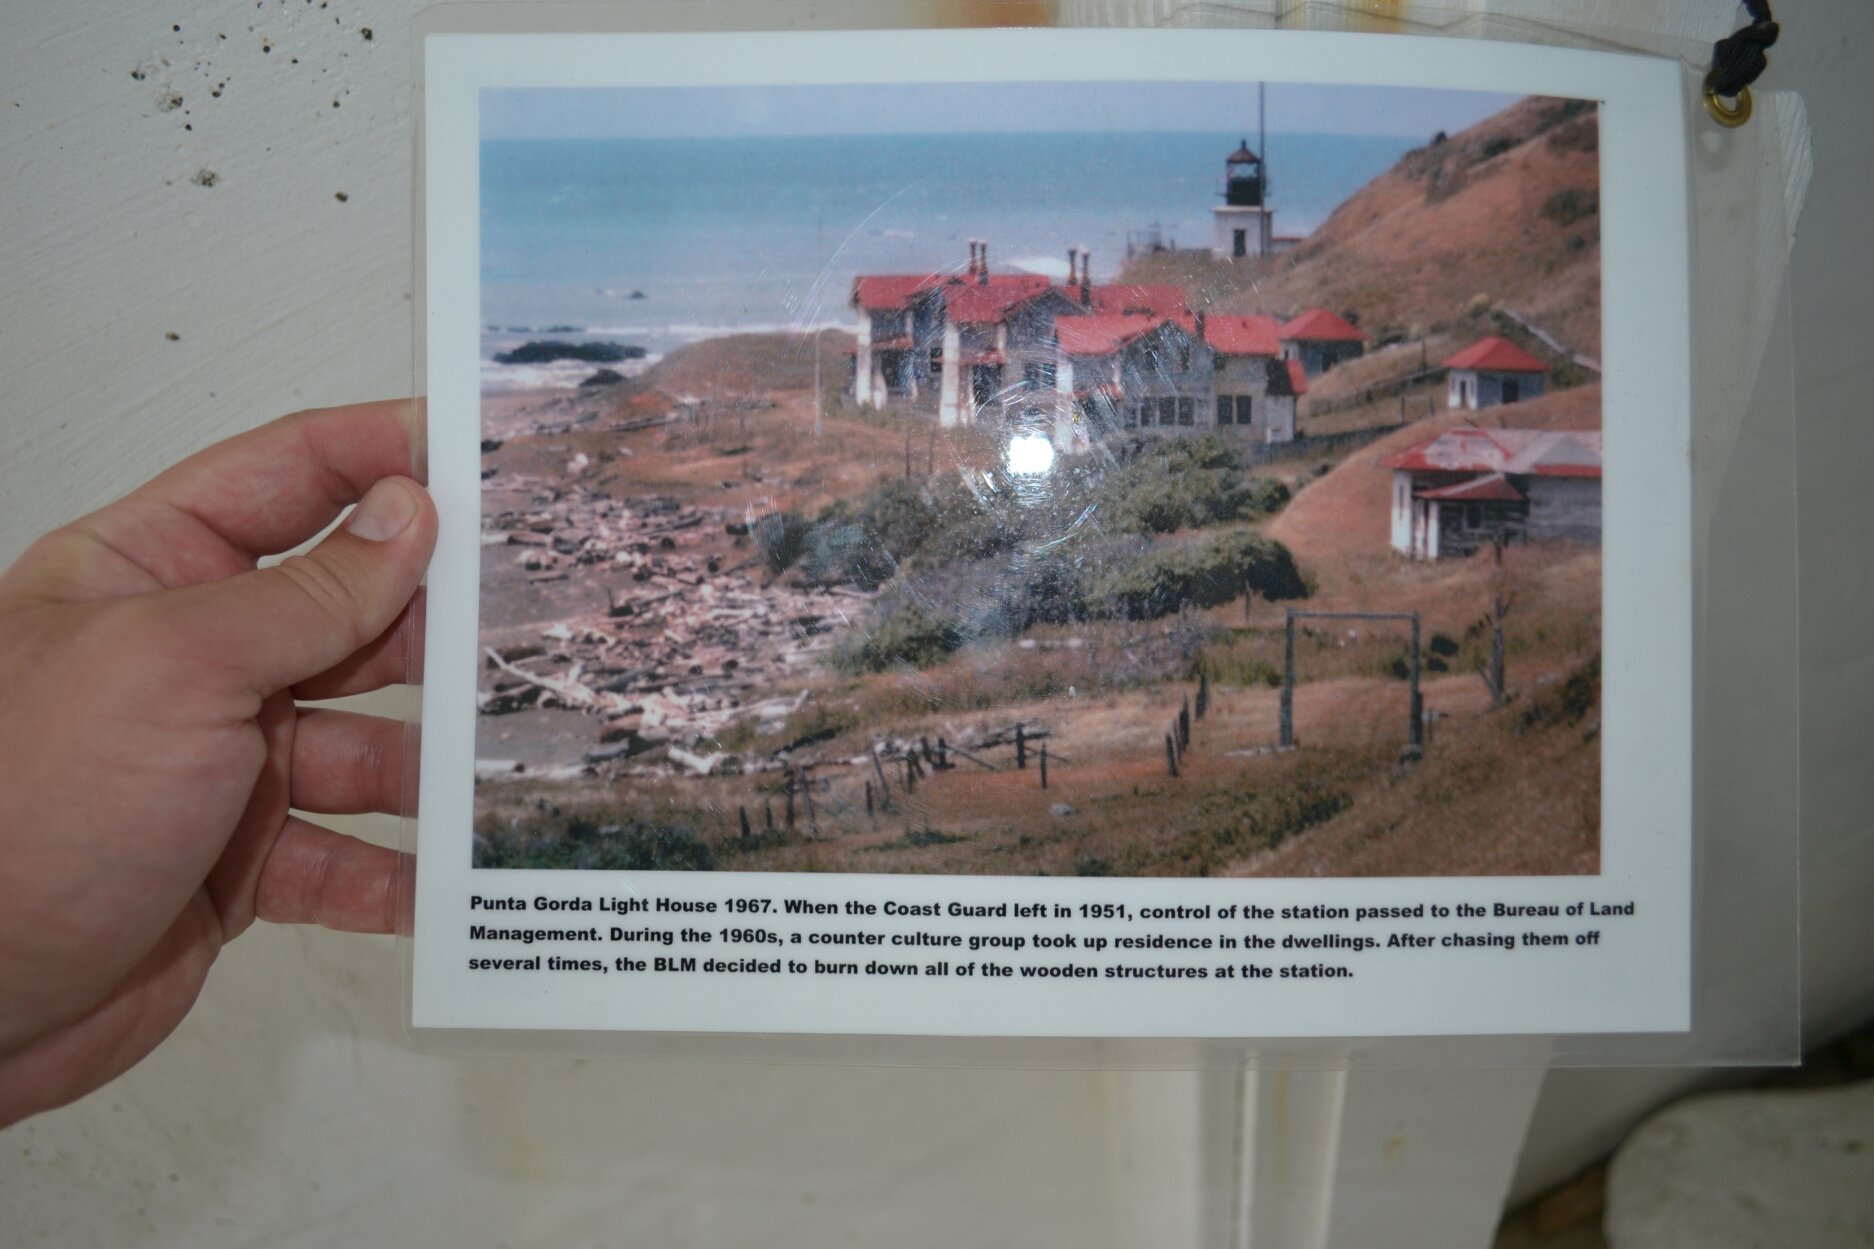
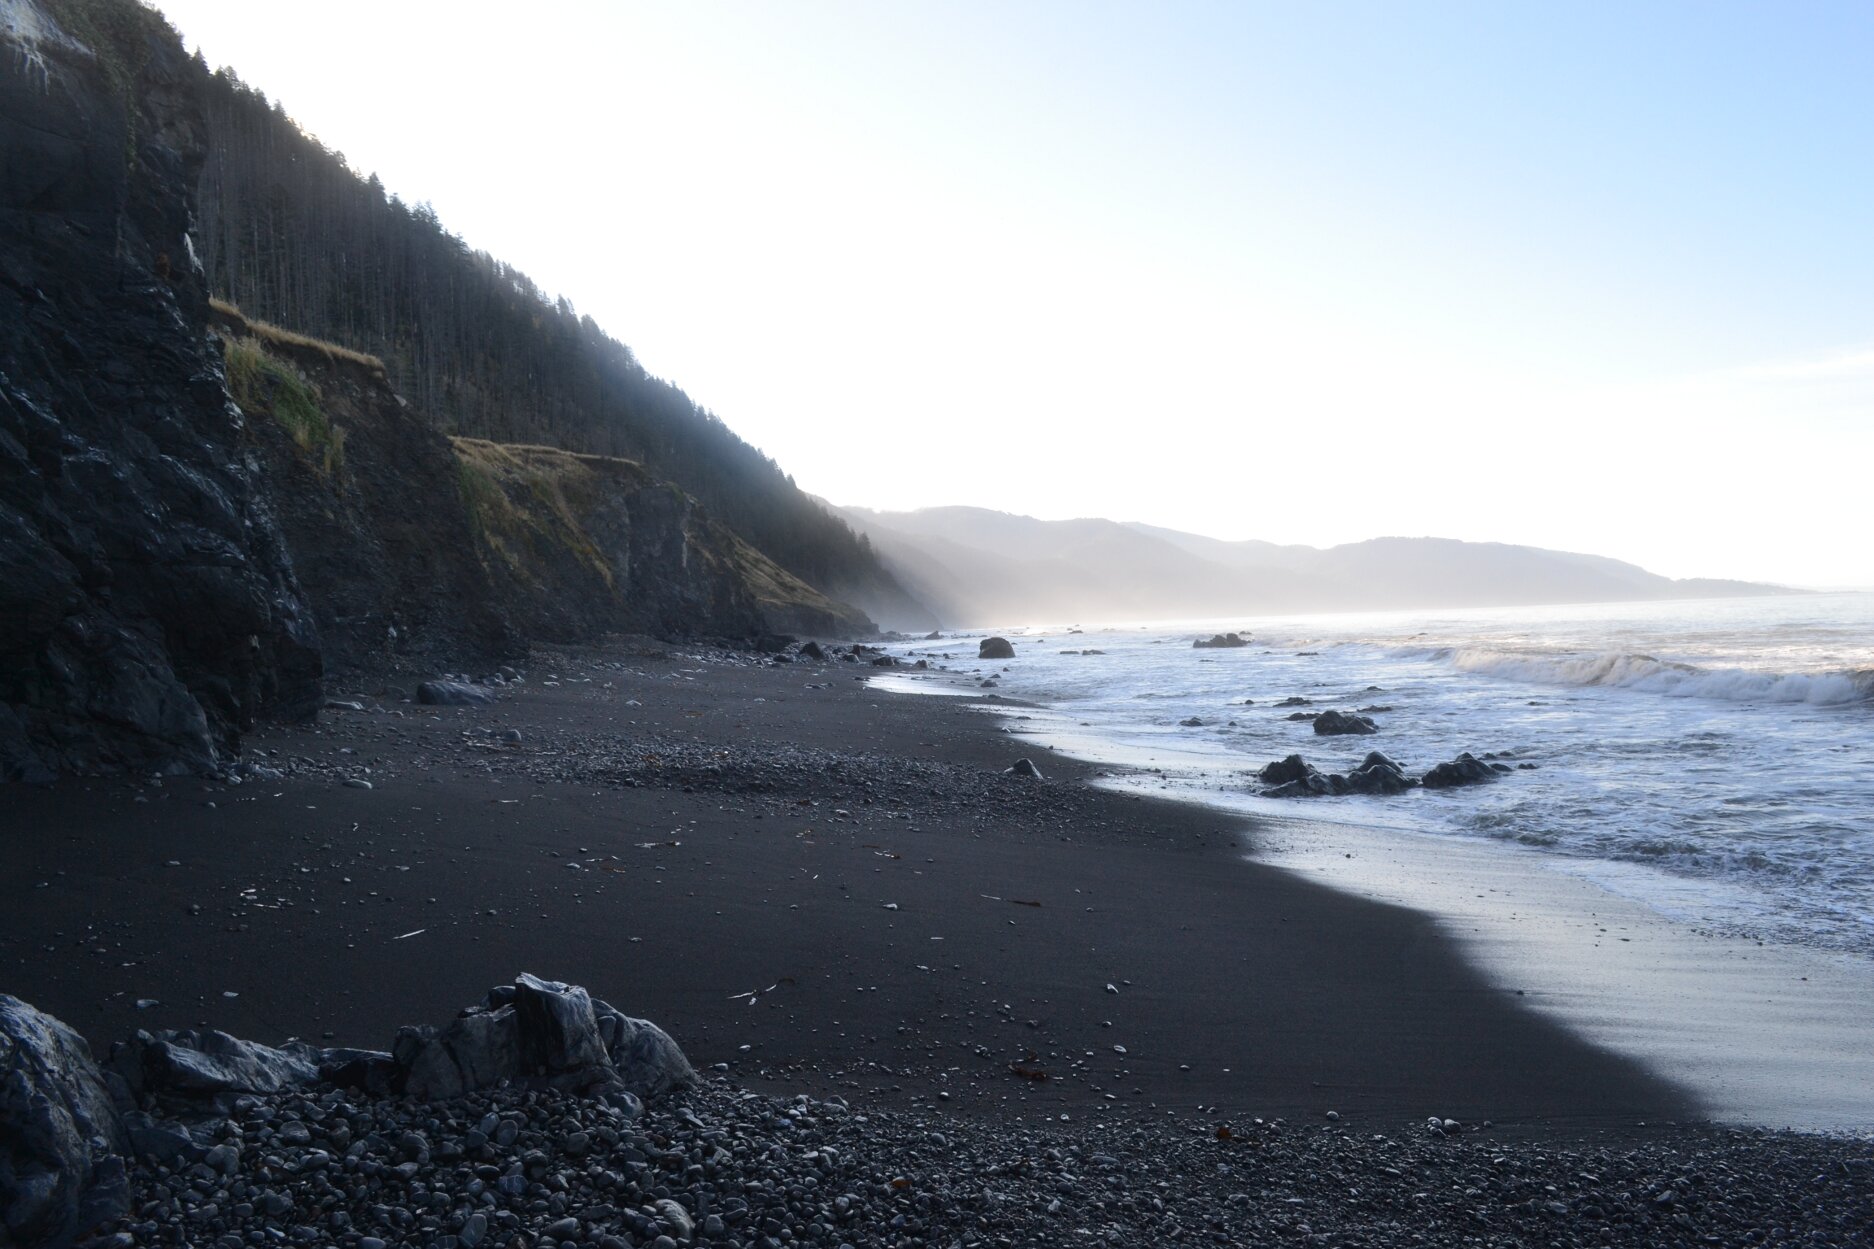
Maps of the area will mark three sections of the trail that are impassable at high tide.  The first one is right by the Punta Gorda Lighthouse and I don’t think its one you need to be concerned with.  It might be the case that you can’t walk along the beach, but this area has a trail that heads up onto a flat that will allow you to pass.  The other two marked stretches are 4 and 4.5 miles of beach hiking that will at times come to very narrow points along the beach.  The mountains are right up against the beach here and will indeed block your progress until low tide.

Being someone that has only lived in landlocked places, tides were a whole new thing for me. I knew they existed and could even tell you why they happen (you can’t explain that!), but had never given thought to them.  Get a tide table from a BLM office or look it up online.  I like this one quite a bit because it offers a visual of the tide levels.  That specific one will be out of date when you are looking, so just Google for it.


The Shuttle

I parked my rental car at the southern tail head (Black Sands Beach in Shelter Cove) and caught a shuttle up to the Mattole trail head.  I rode with Lost Coast Shuttle and give them a huge, glowing recommendation.  I contacted them by email a couple weeks out and asked to be worked into another group since I was solo.  They worked it out wonderfully and Jill (my shuttle-er) picked us up with maps, permits, etc in hand for us.  Really great folks.

If you have two cars and want to shuttle yourself do be aware that even though its only 25 miles by beach its a much longer trip through the mountain roads.  Our ride took right around two hours.
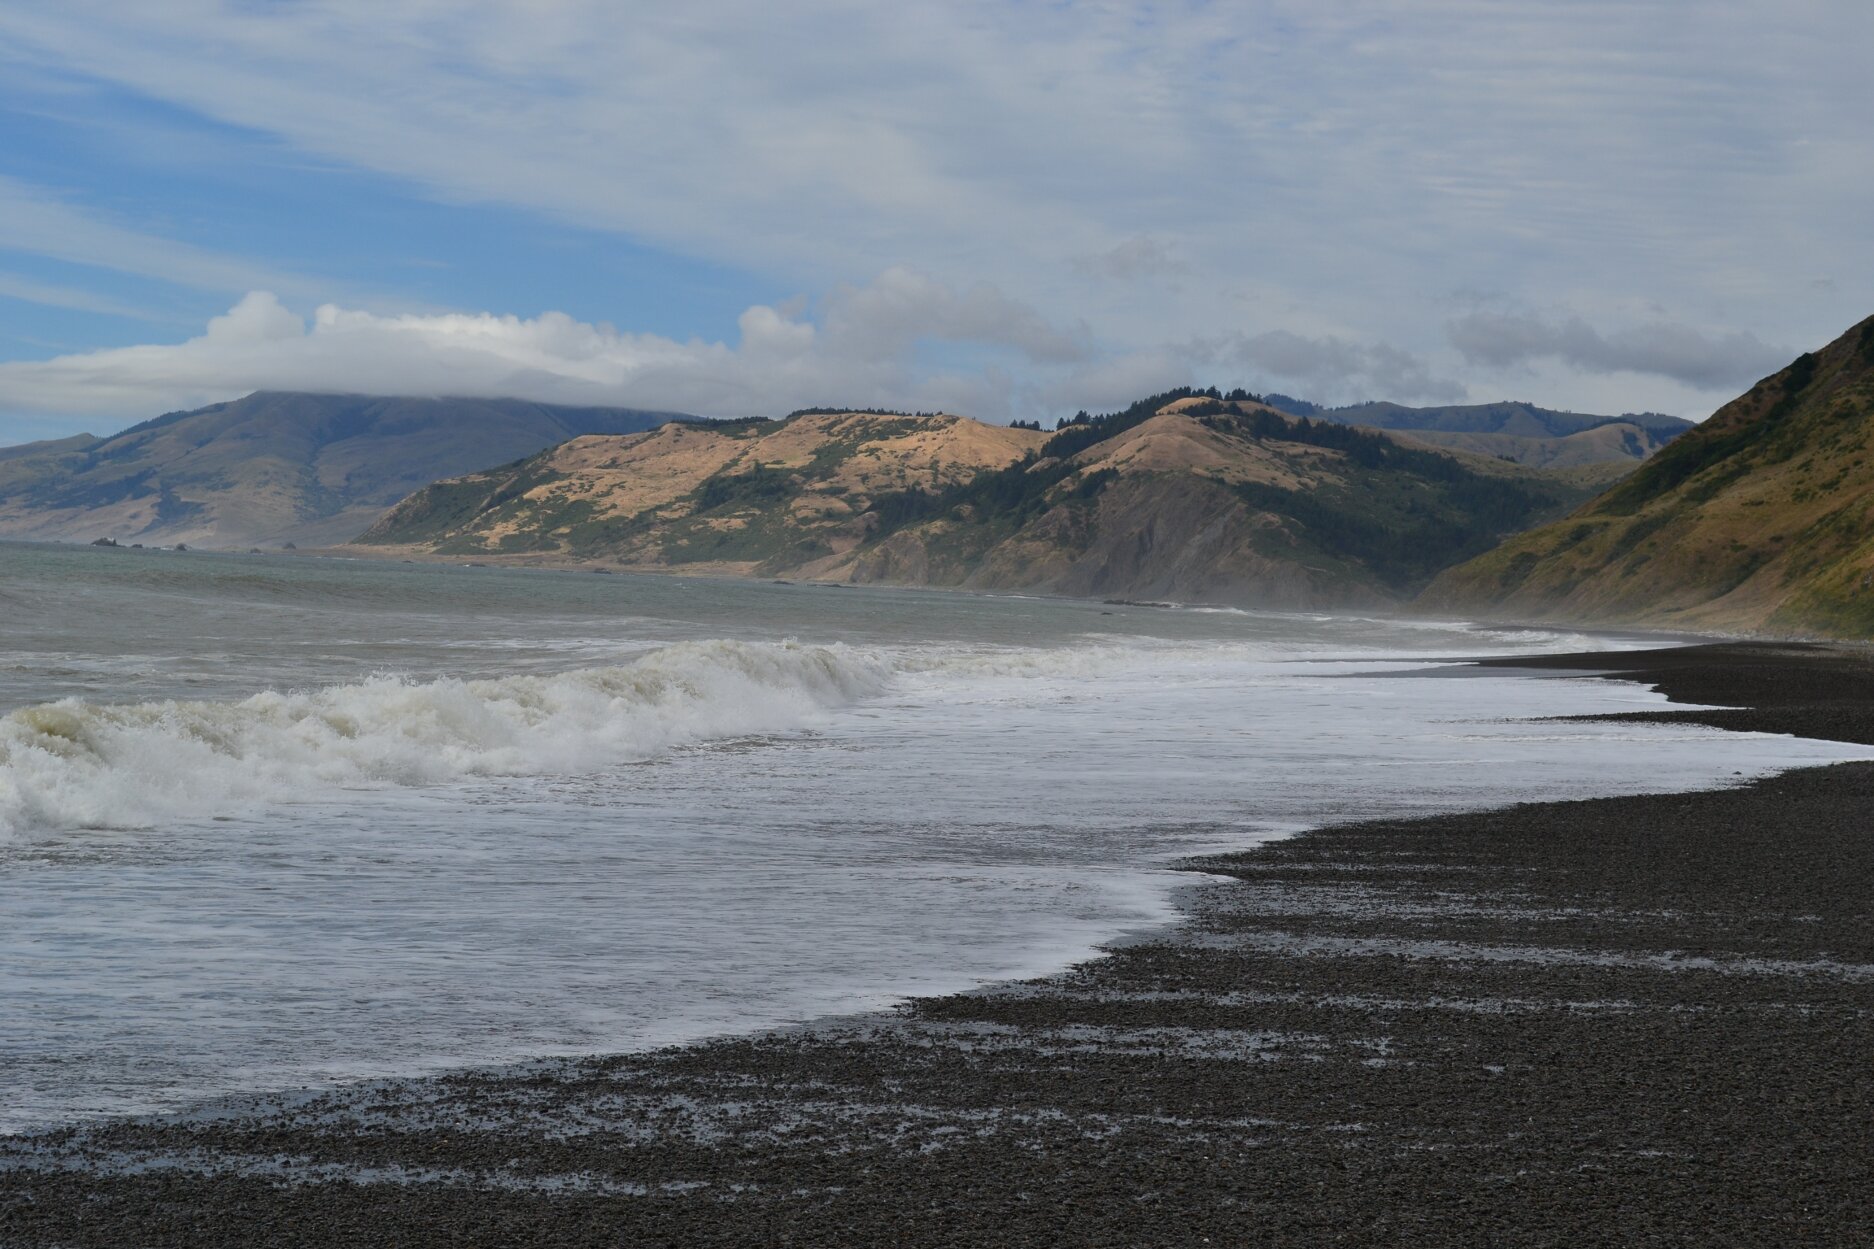
 

The Sand

So you spend two thirds of your time in sand and loose gravel.  Really obvious when you know you are walking on a beach right?  It never occurred to me that this might impact my speed.  I spent the first 20 minutes staring at my feet convinced I was doing something wrong.  Try as I might I couldn’t find a way for my boots not to sink into the sand with every step.  This is what happens when landlocked folks go to the beach.

Even though the trail is flat miles will come a bit harder than you expect.
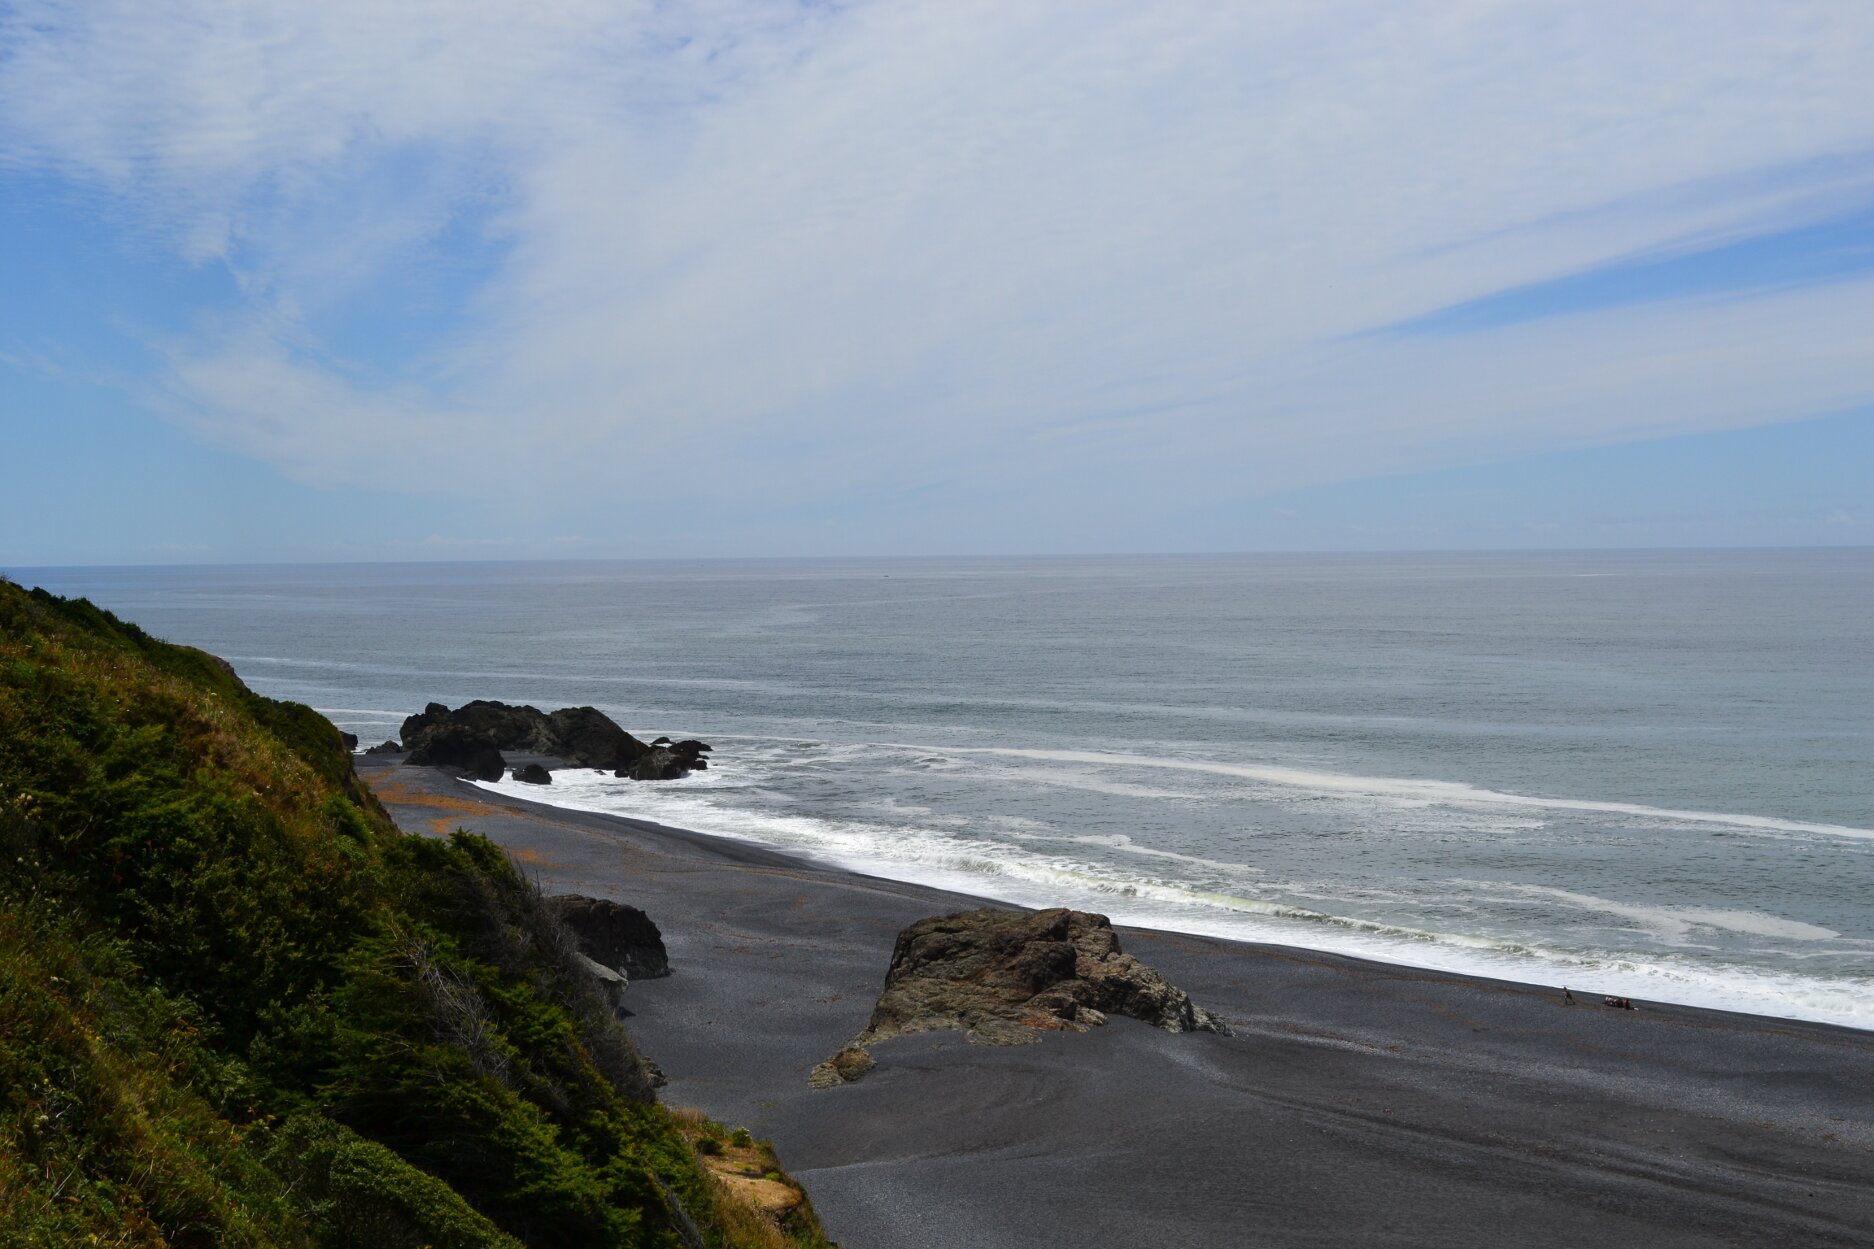
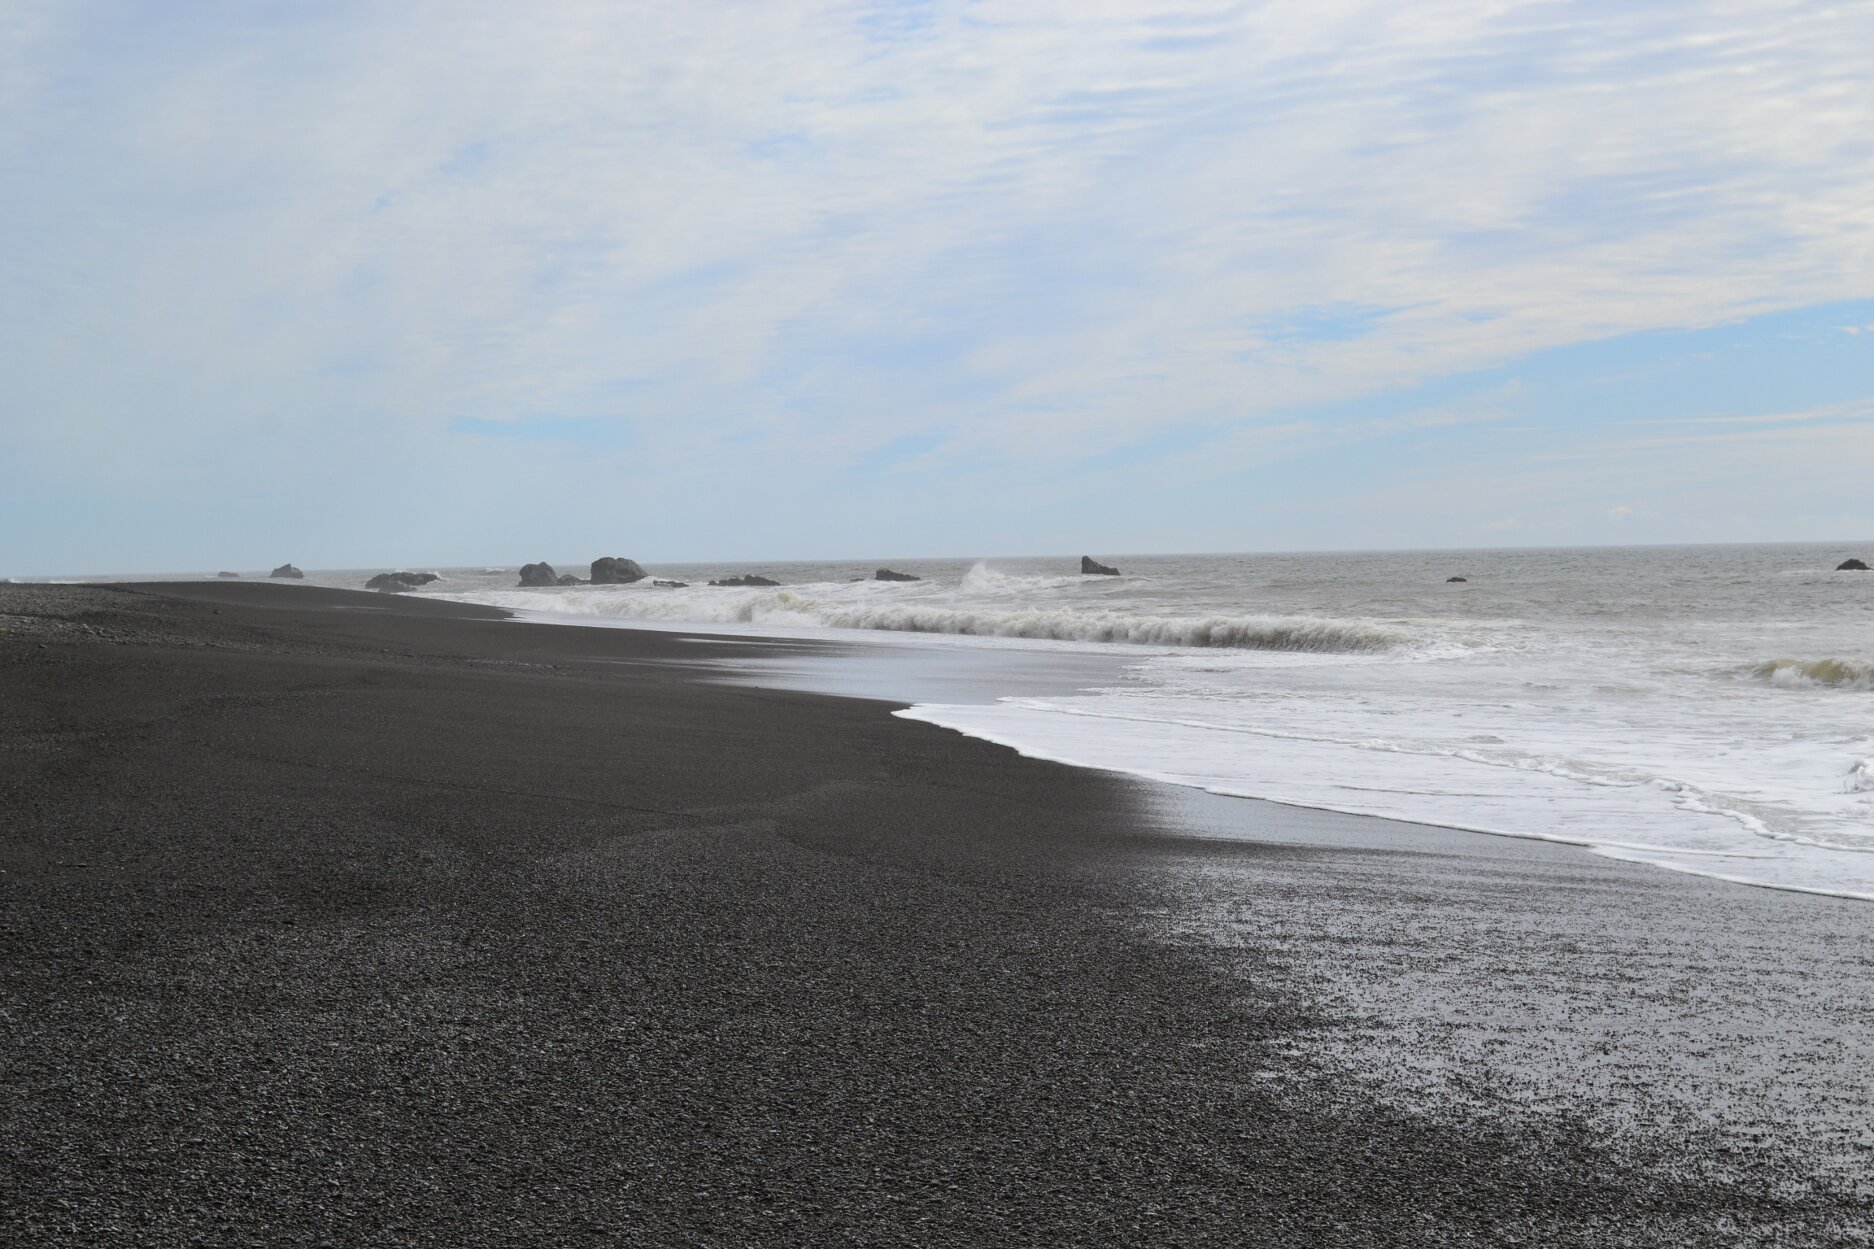
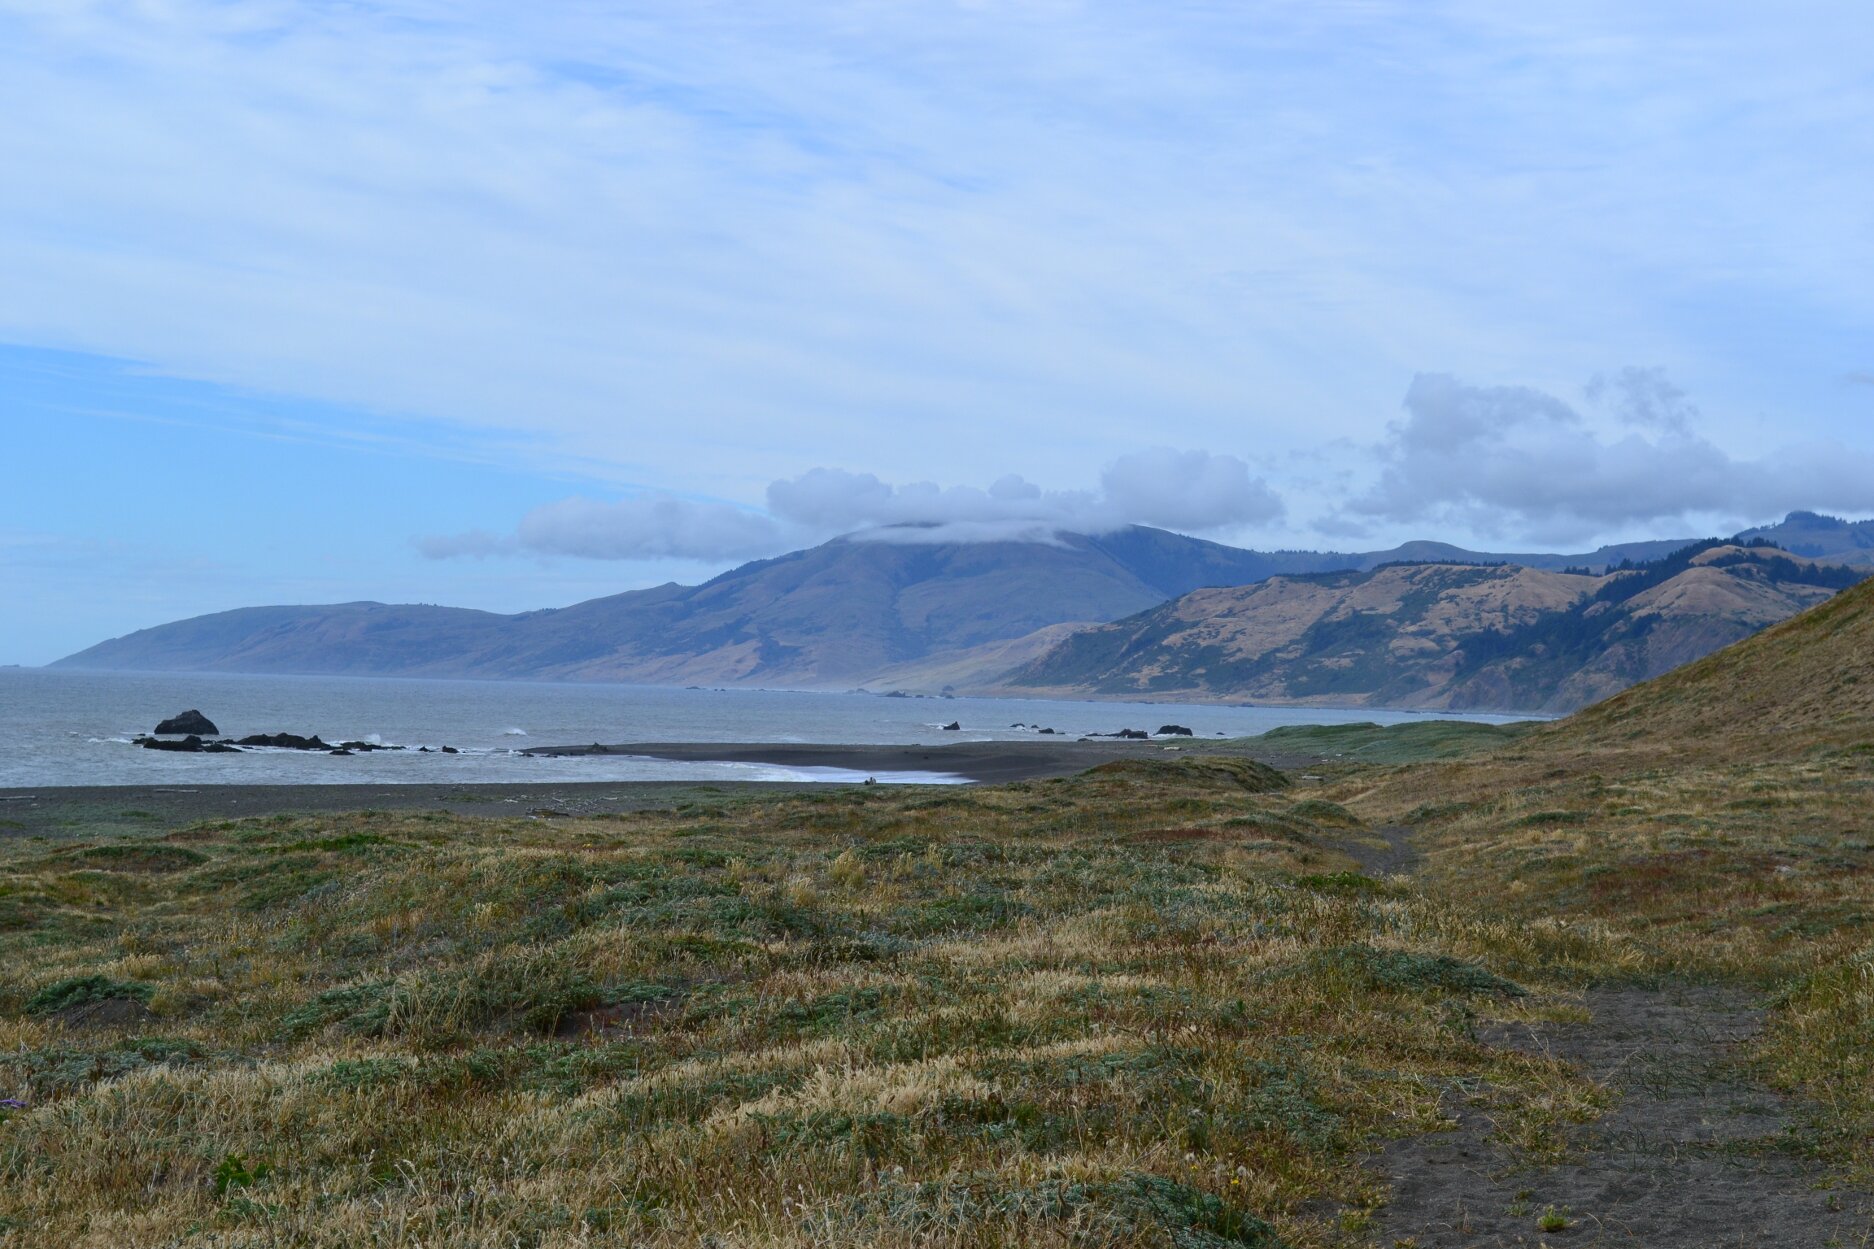
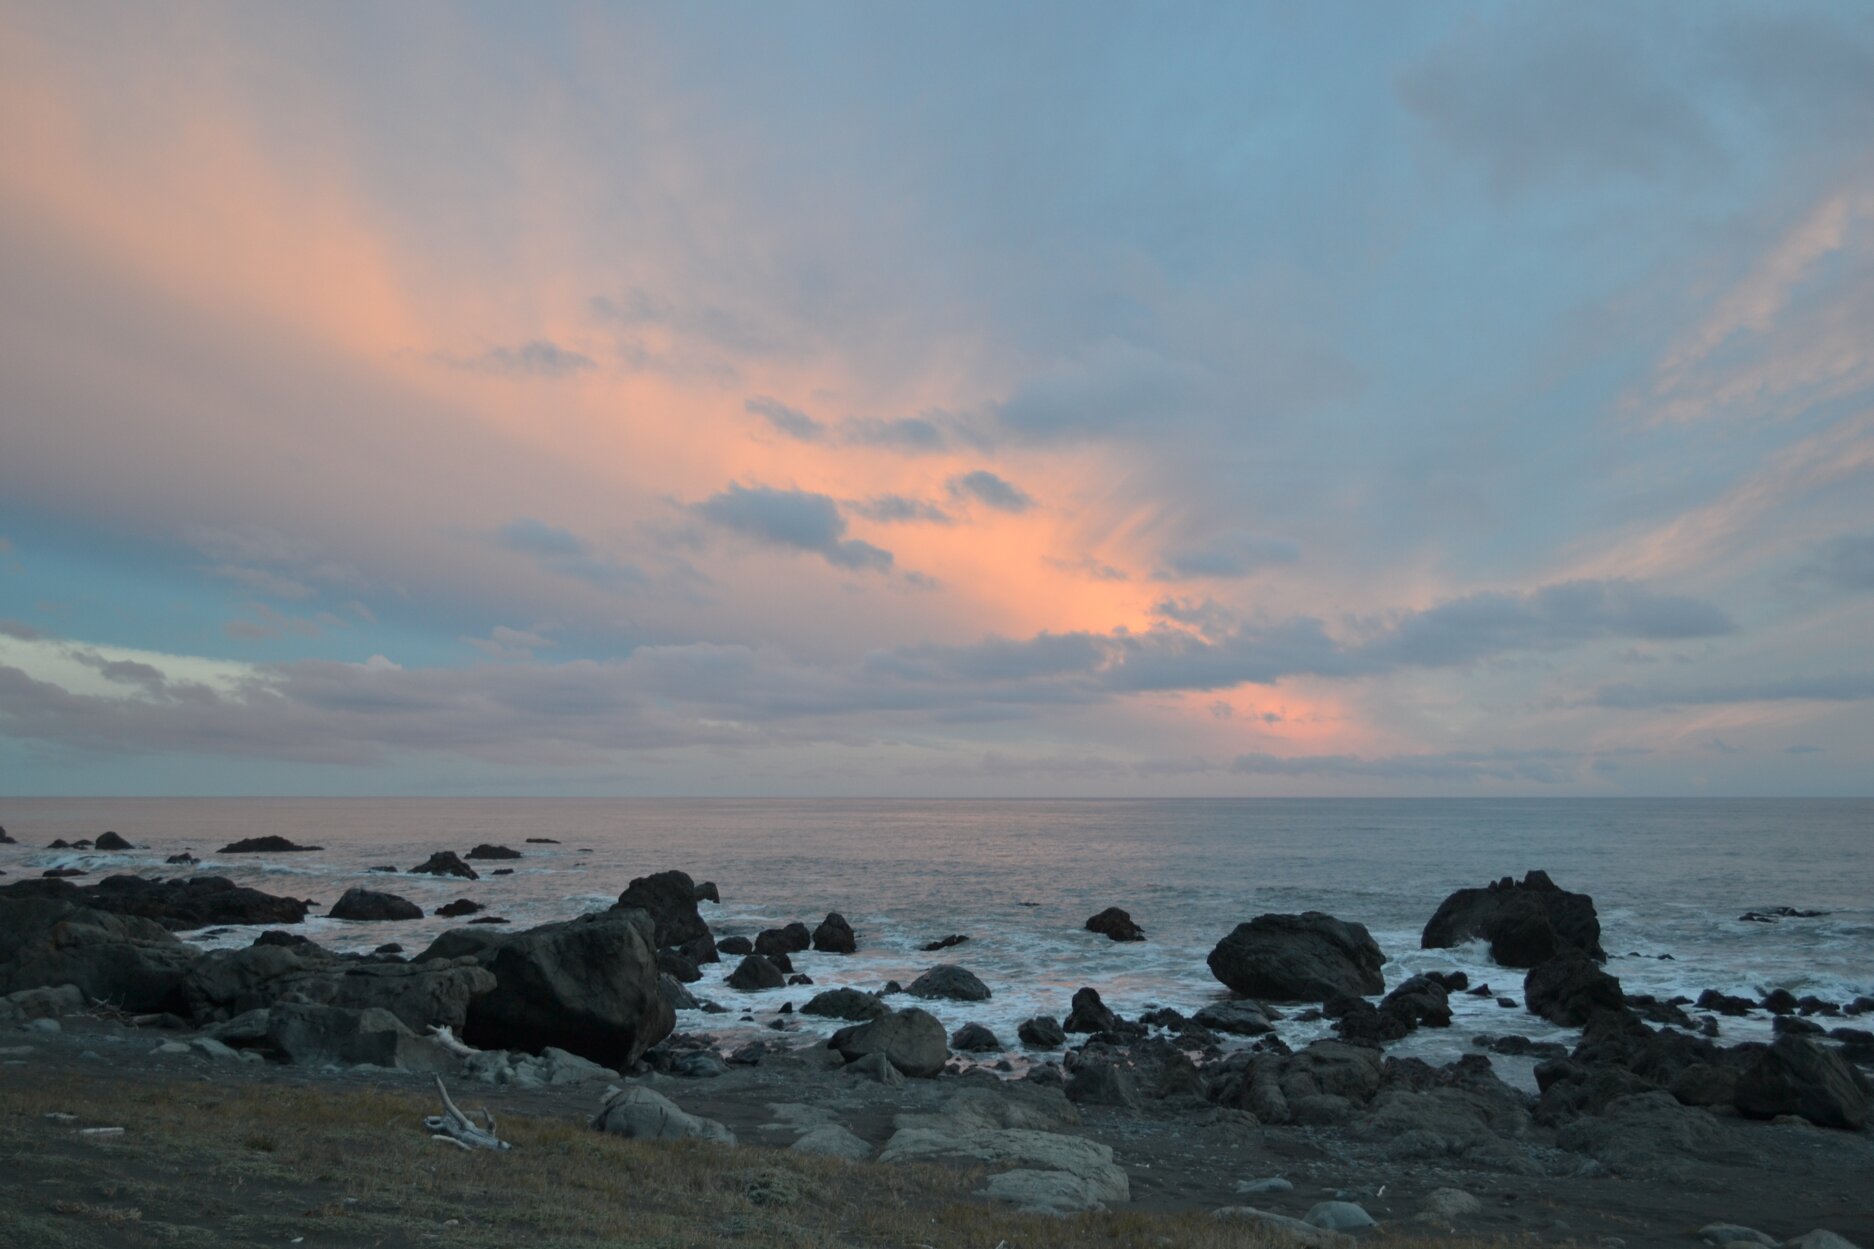
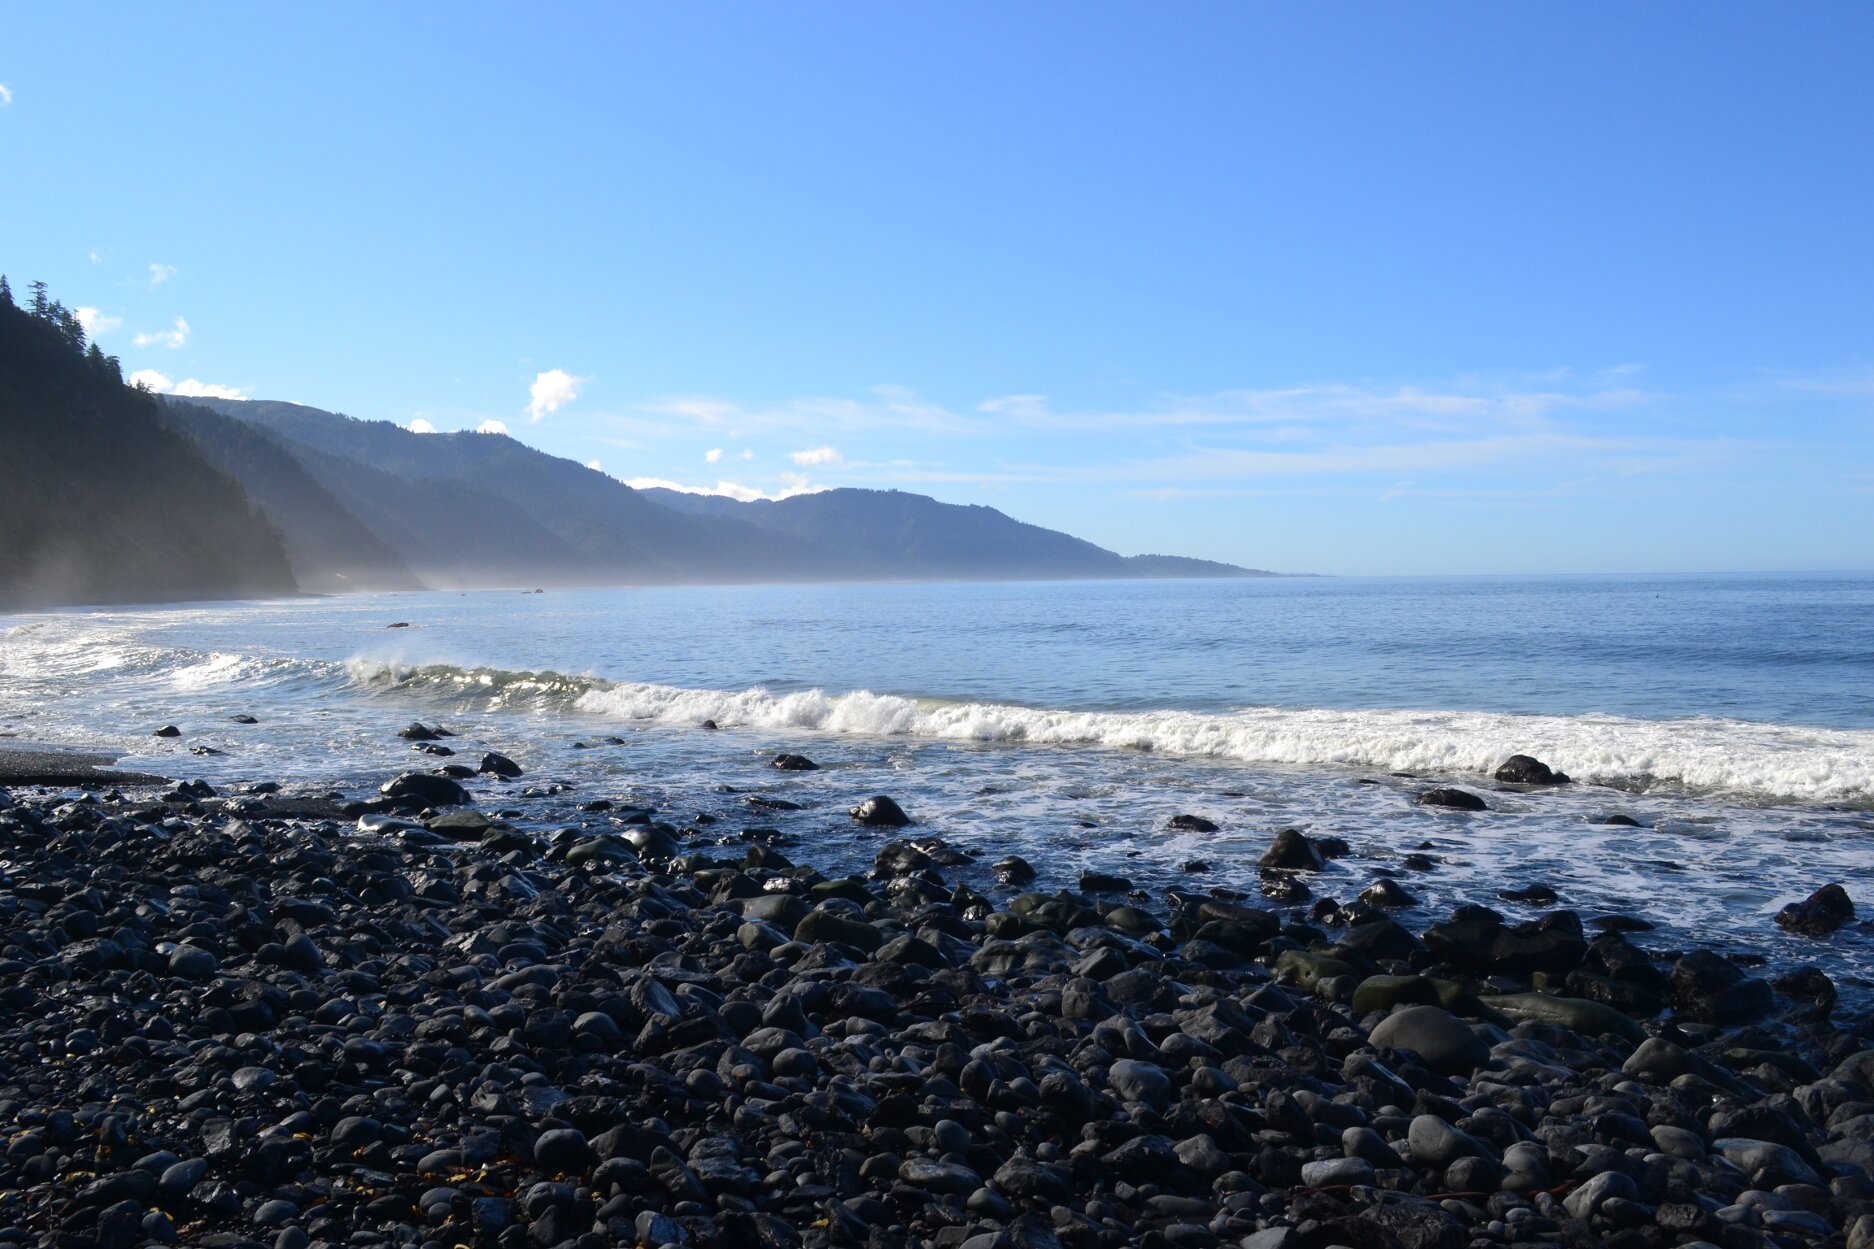
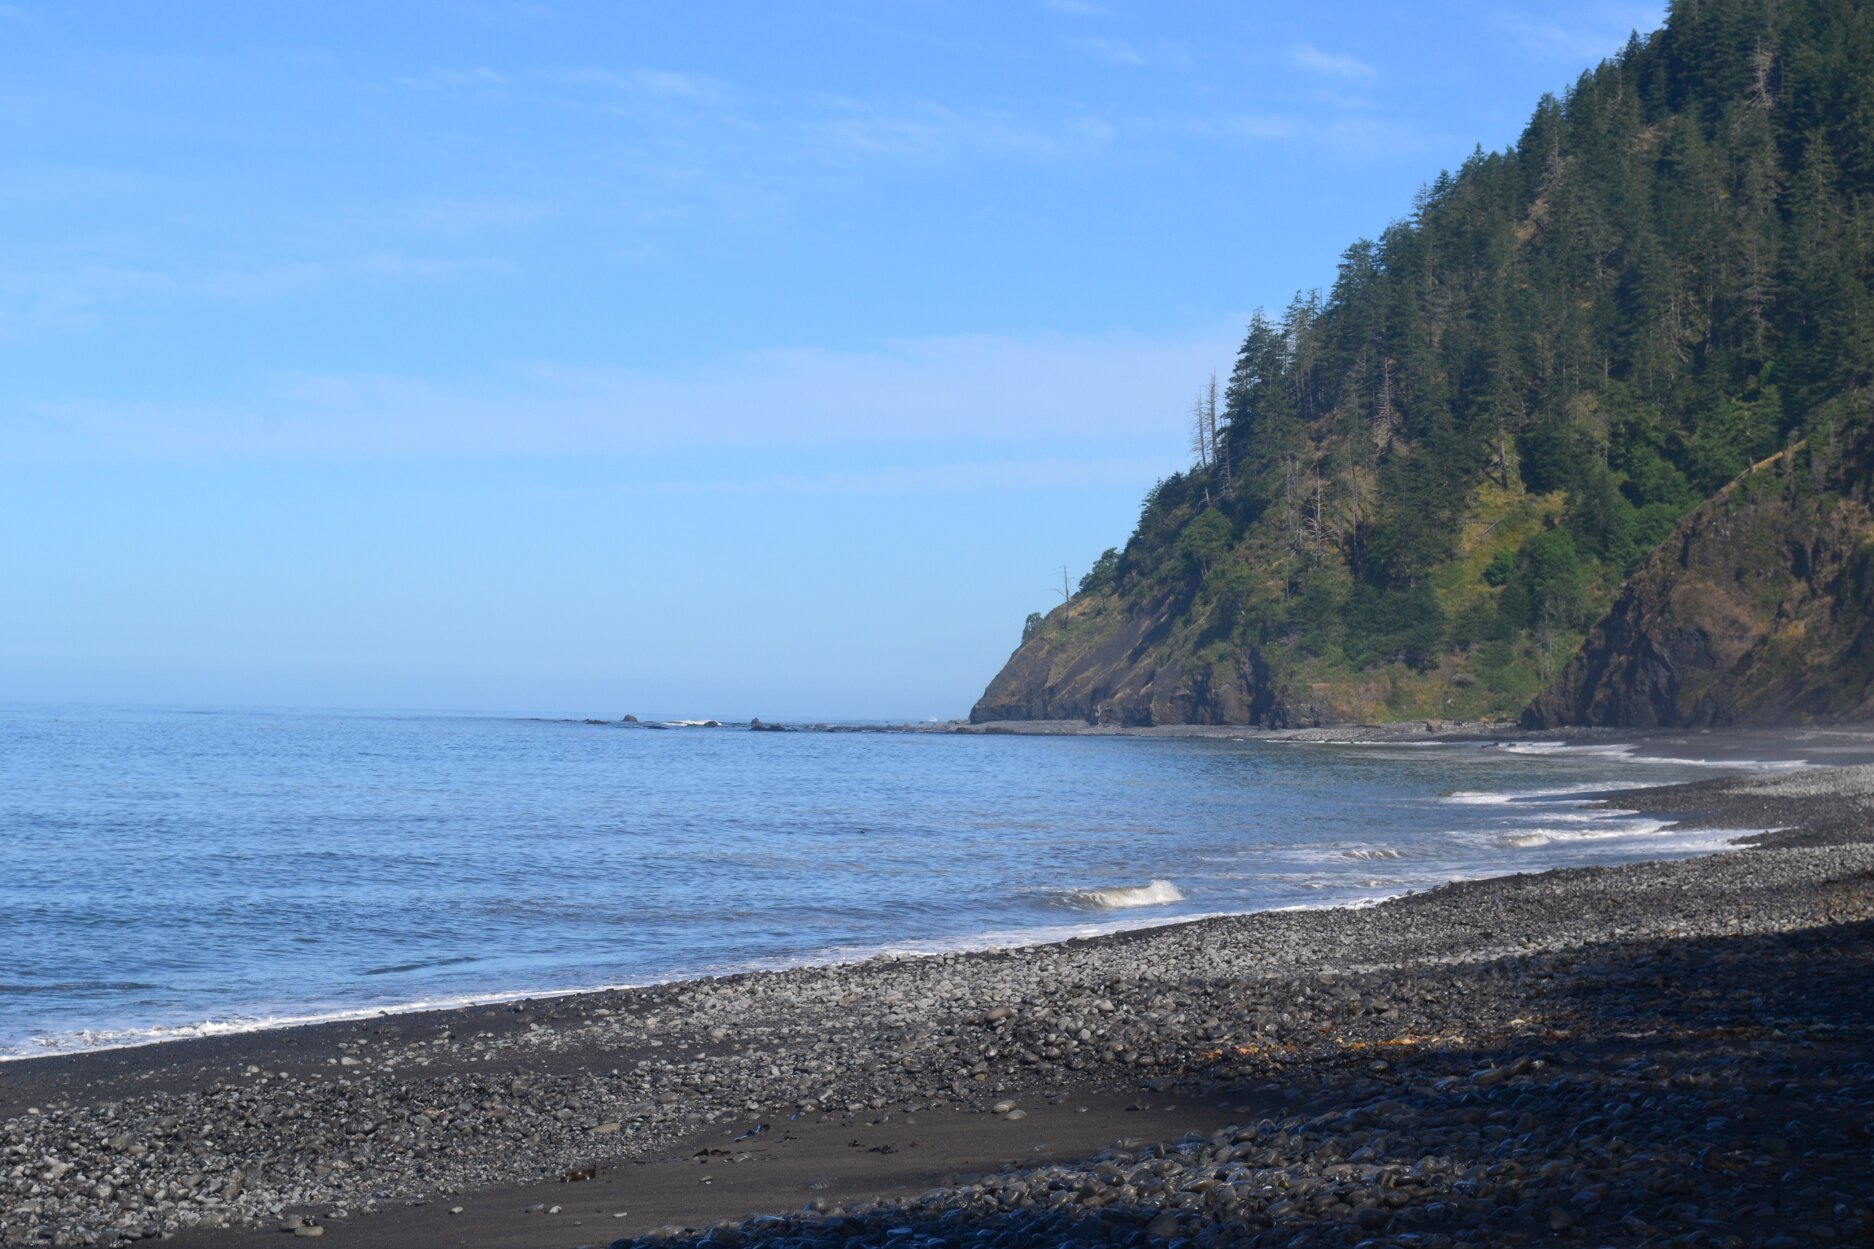
 

The Pictures

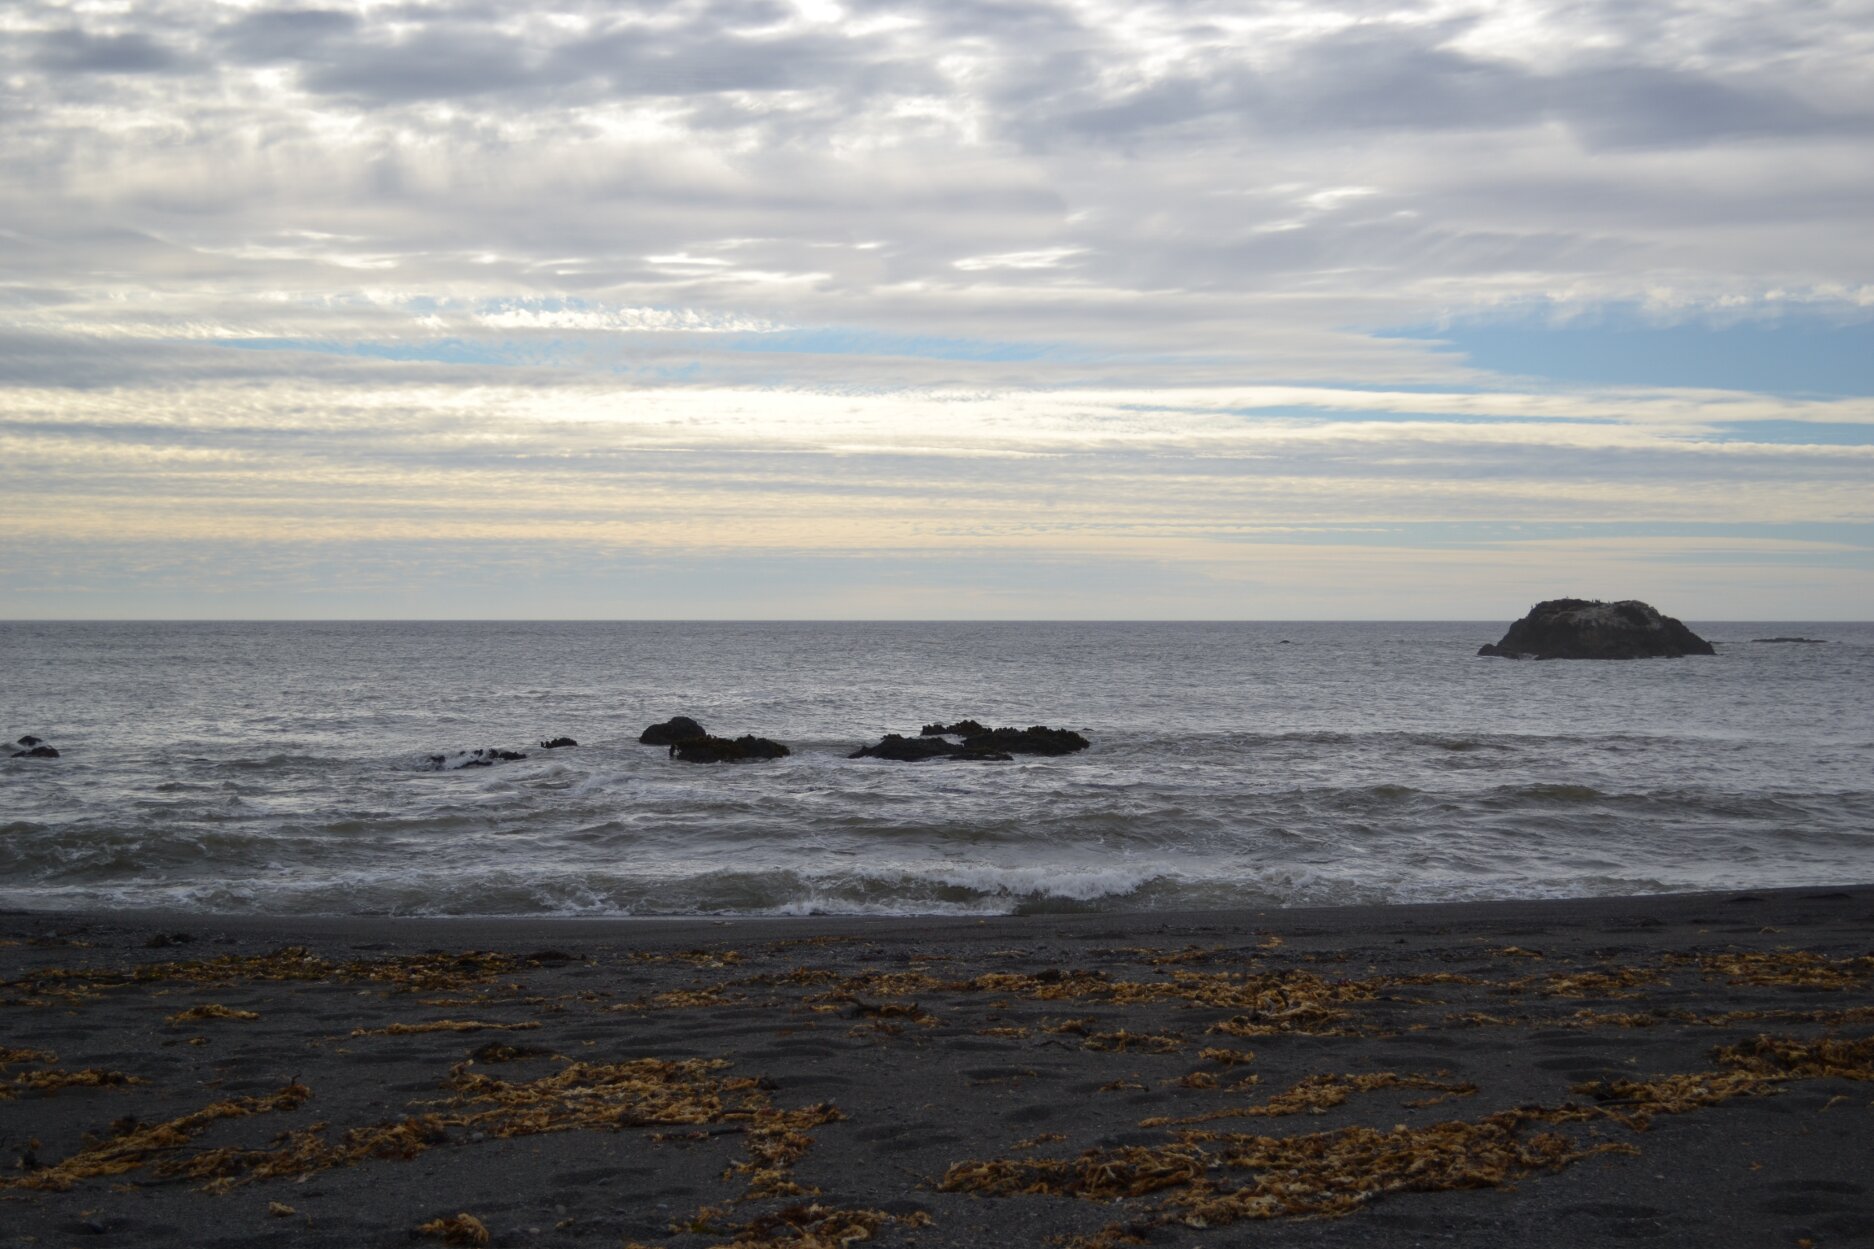
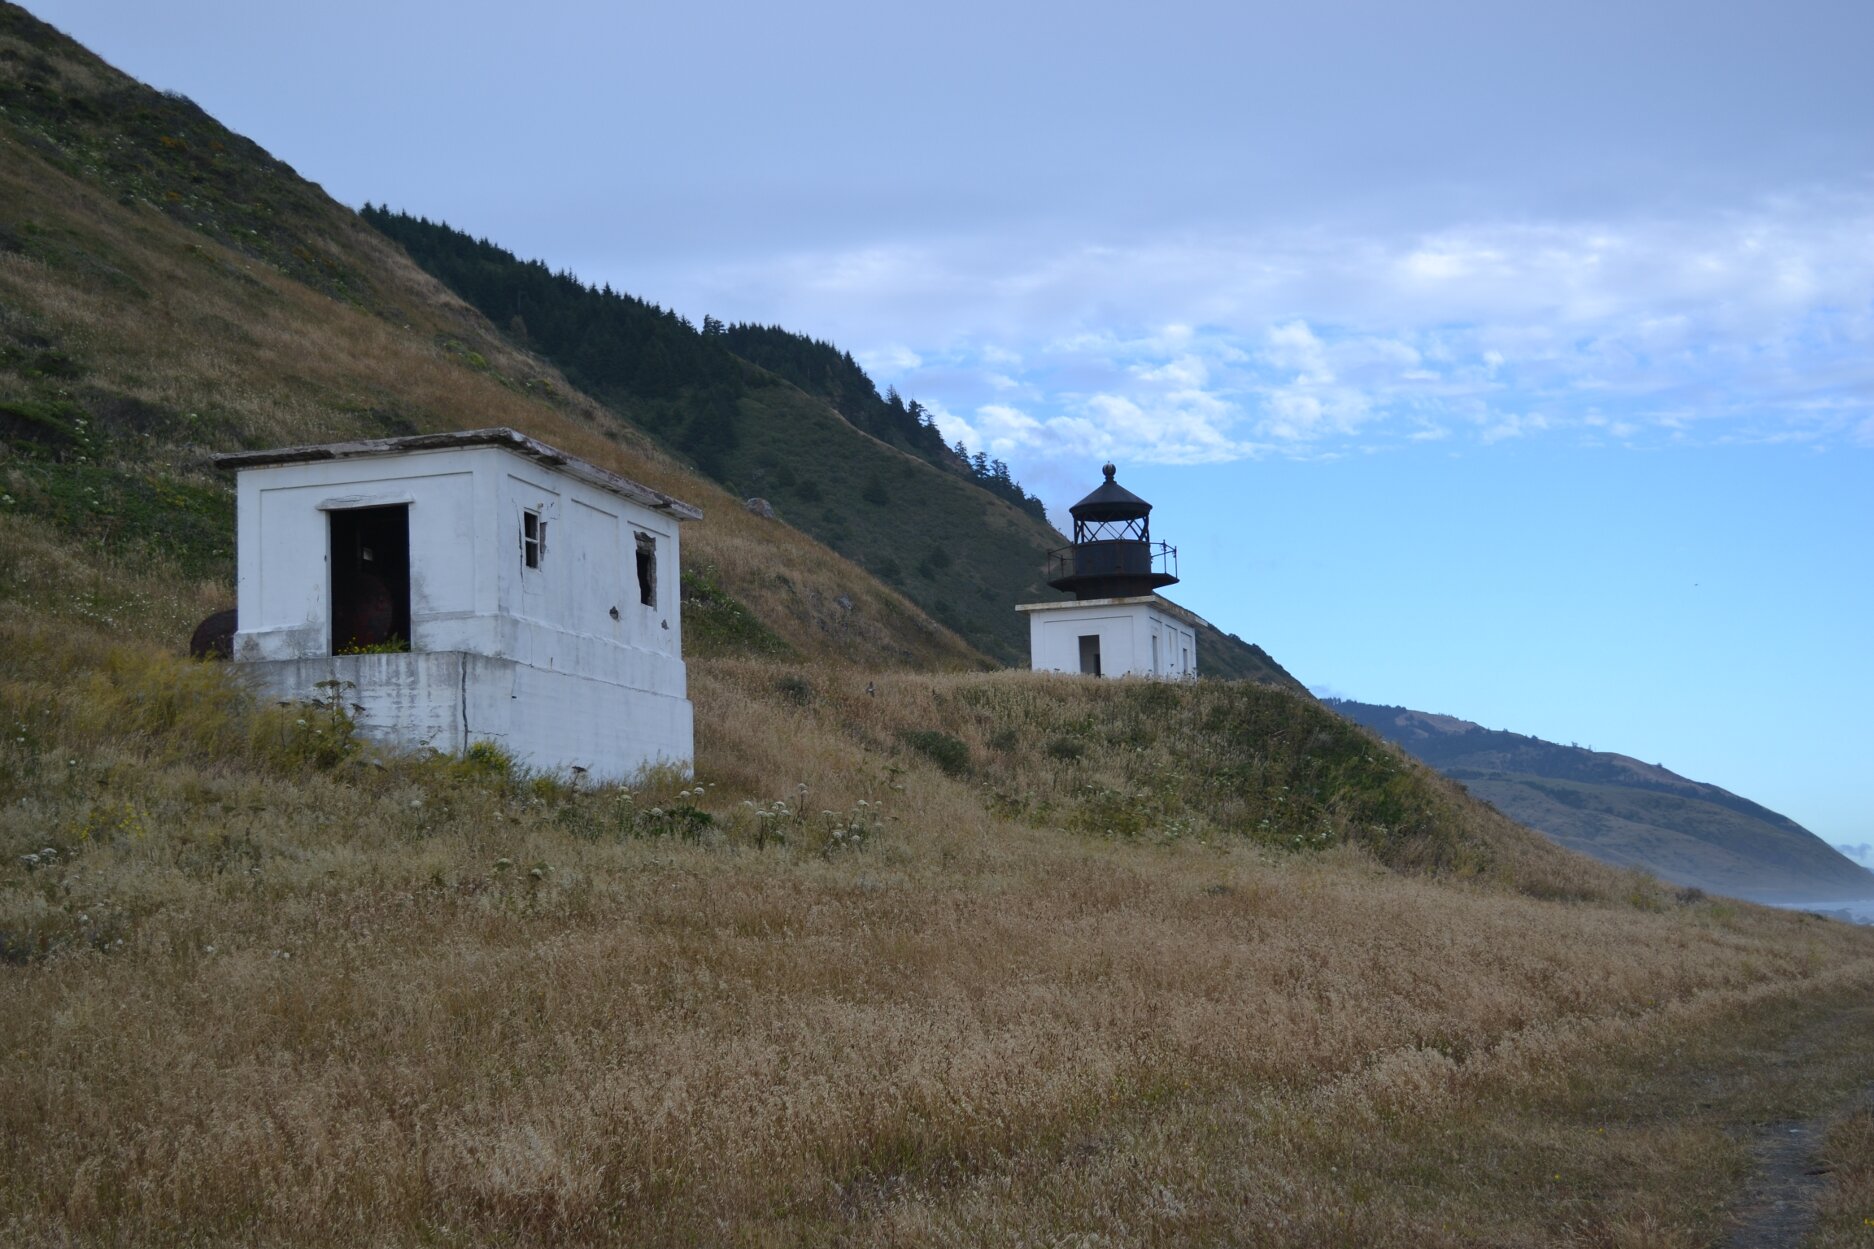
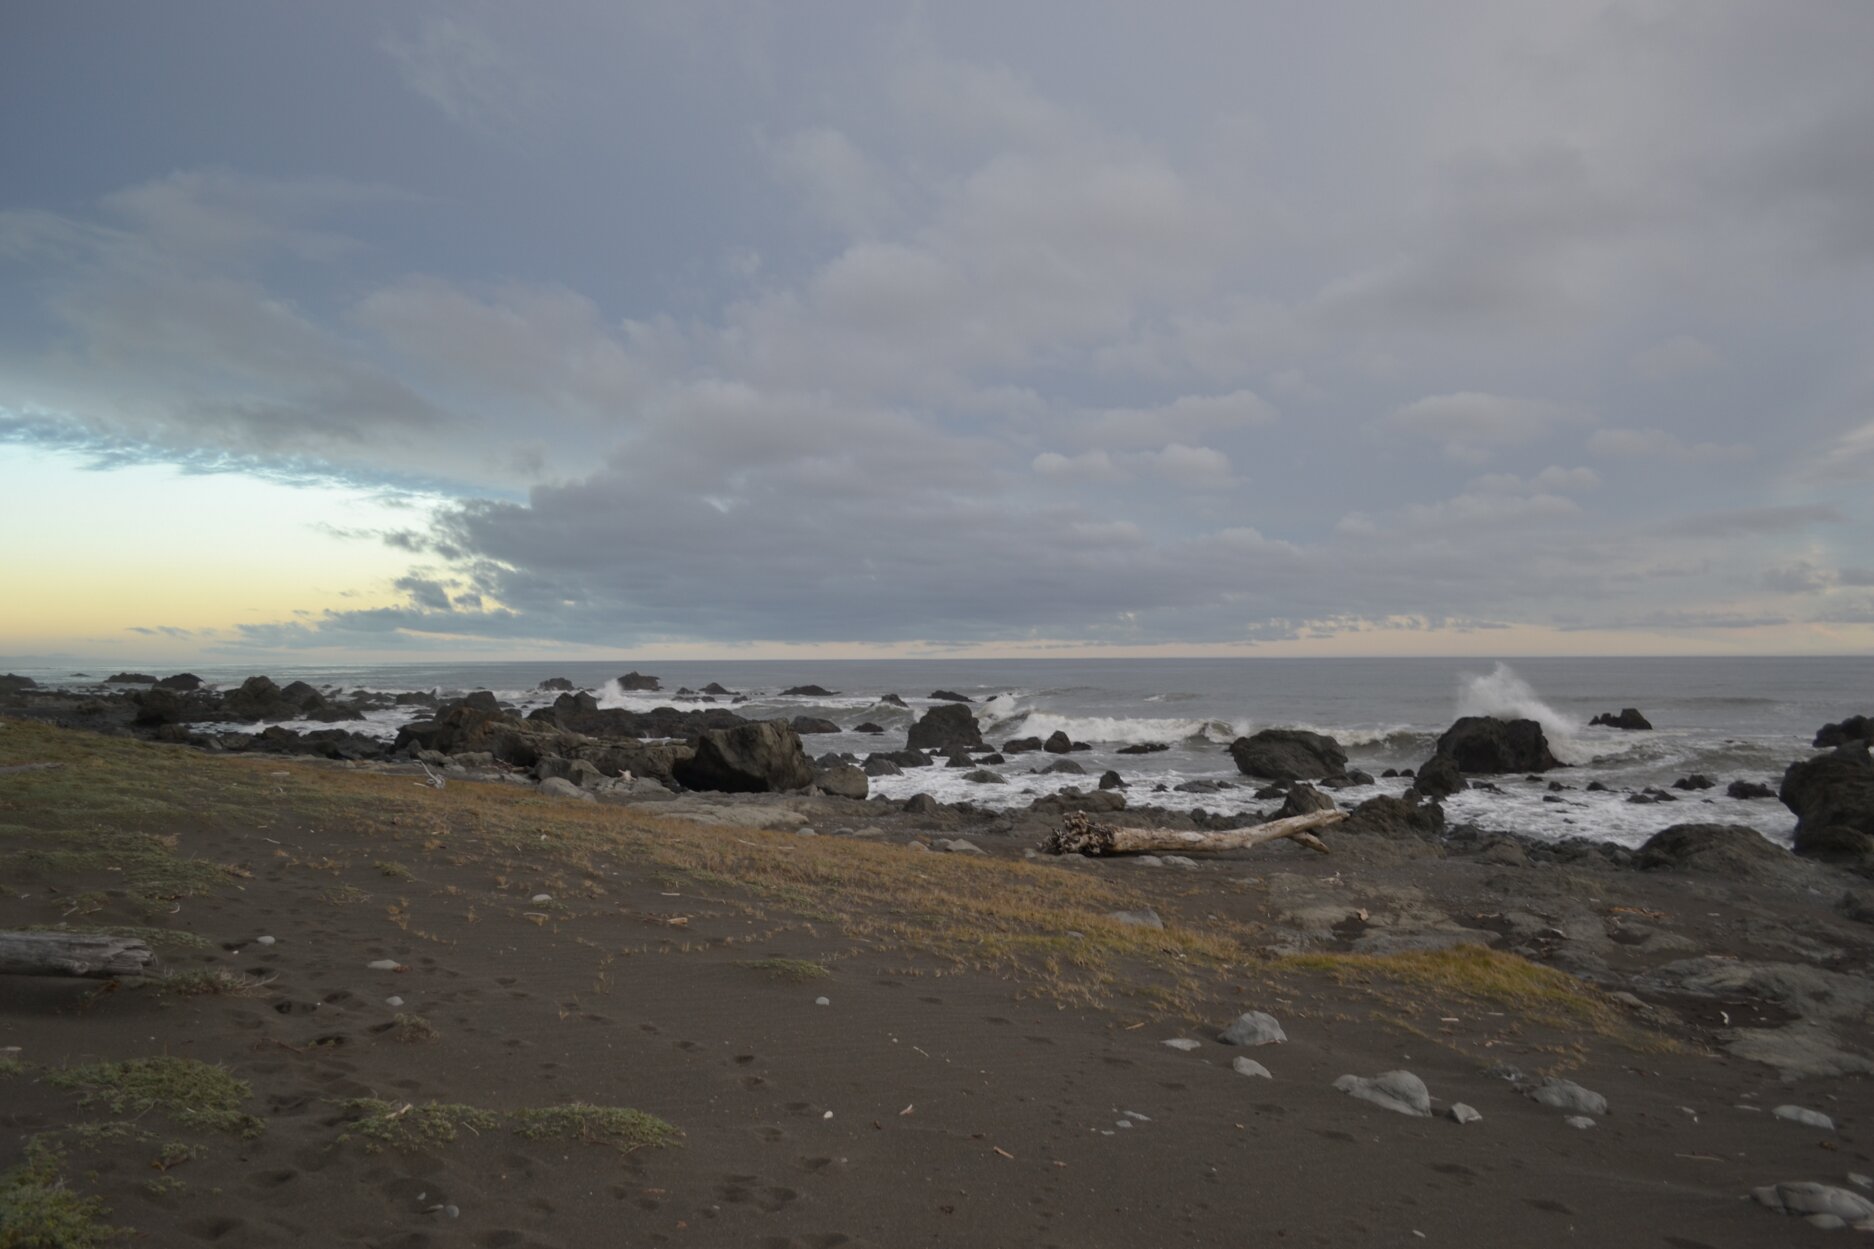
The first two start from an overlook at the Black Sand Beach trail head where I met my shuttle.  Then the trek begins from Mattole, to the Punta Gorda Lighthouse and just beyond where I made camp the first night.  Clouds for the next day’s rain were gathering by sunset.

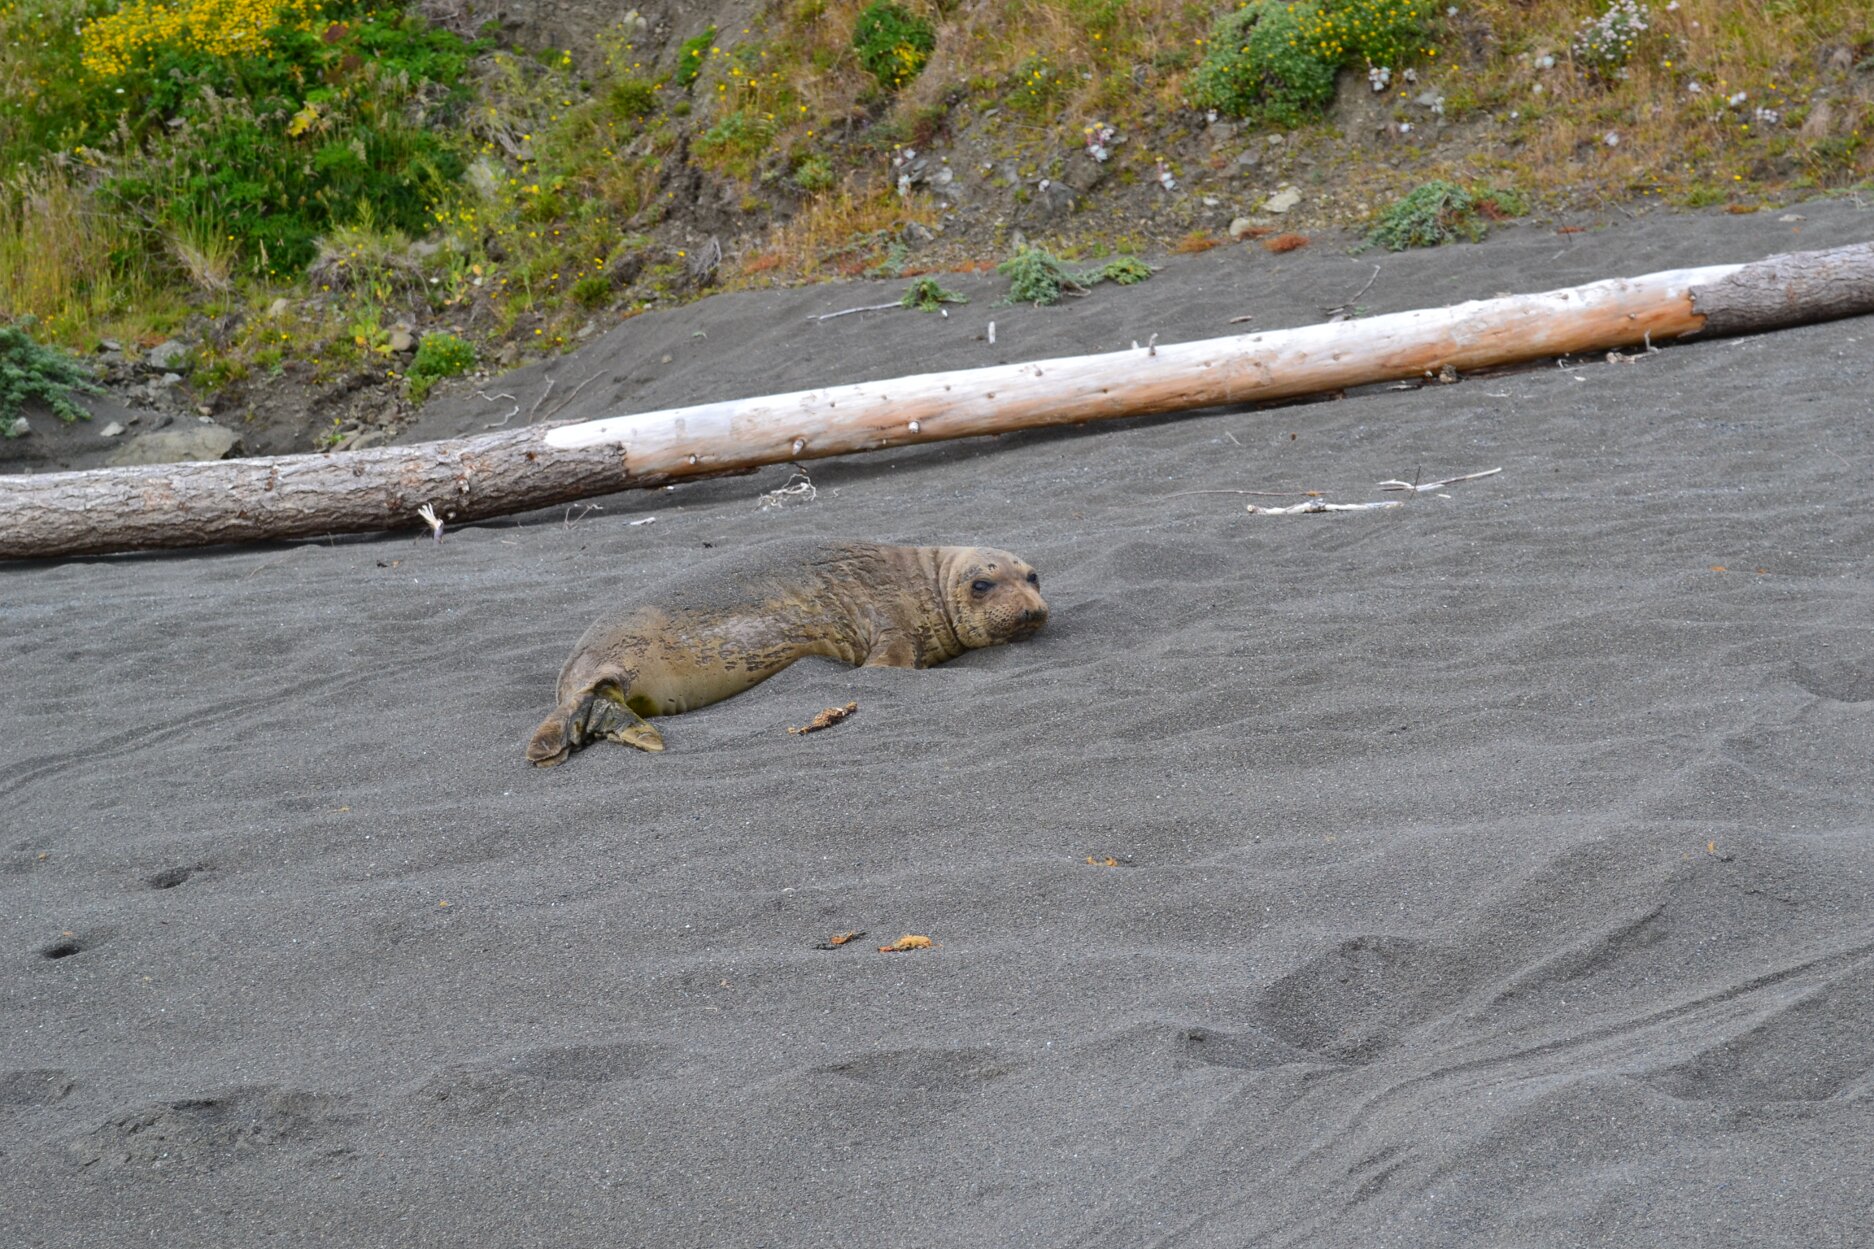
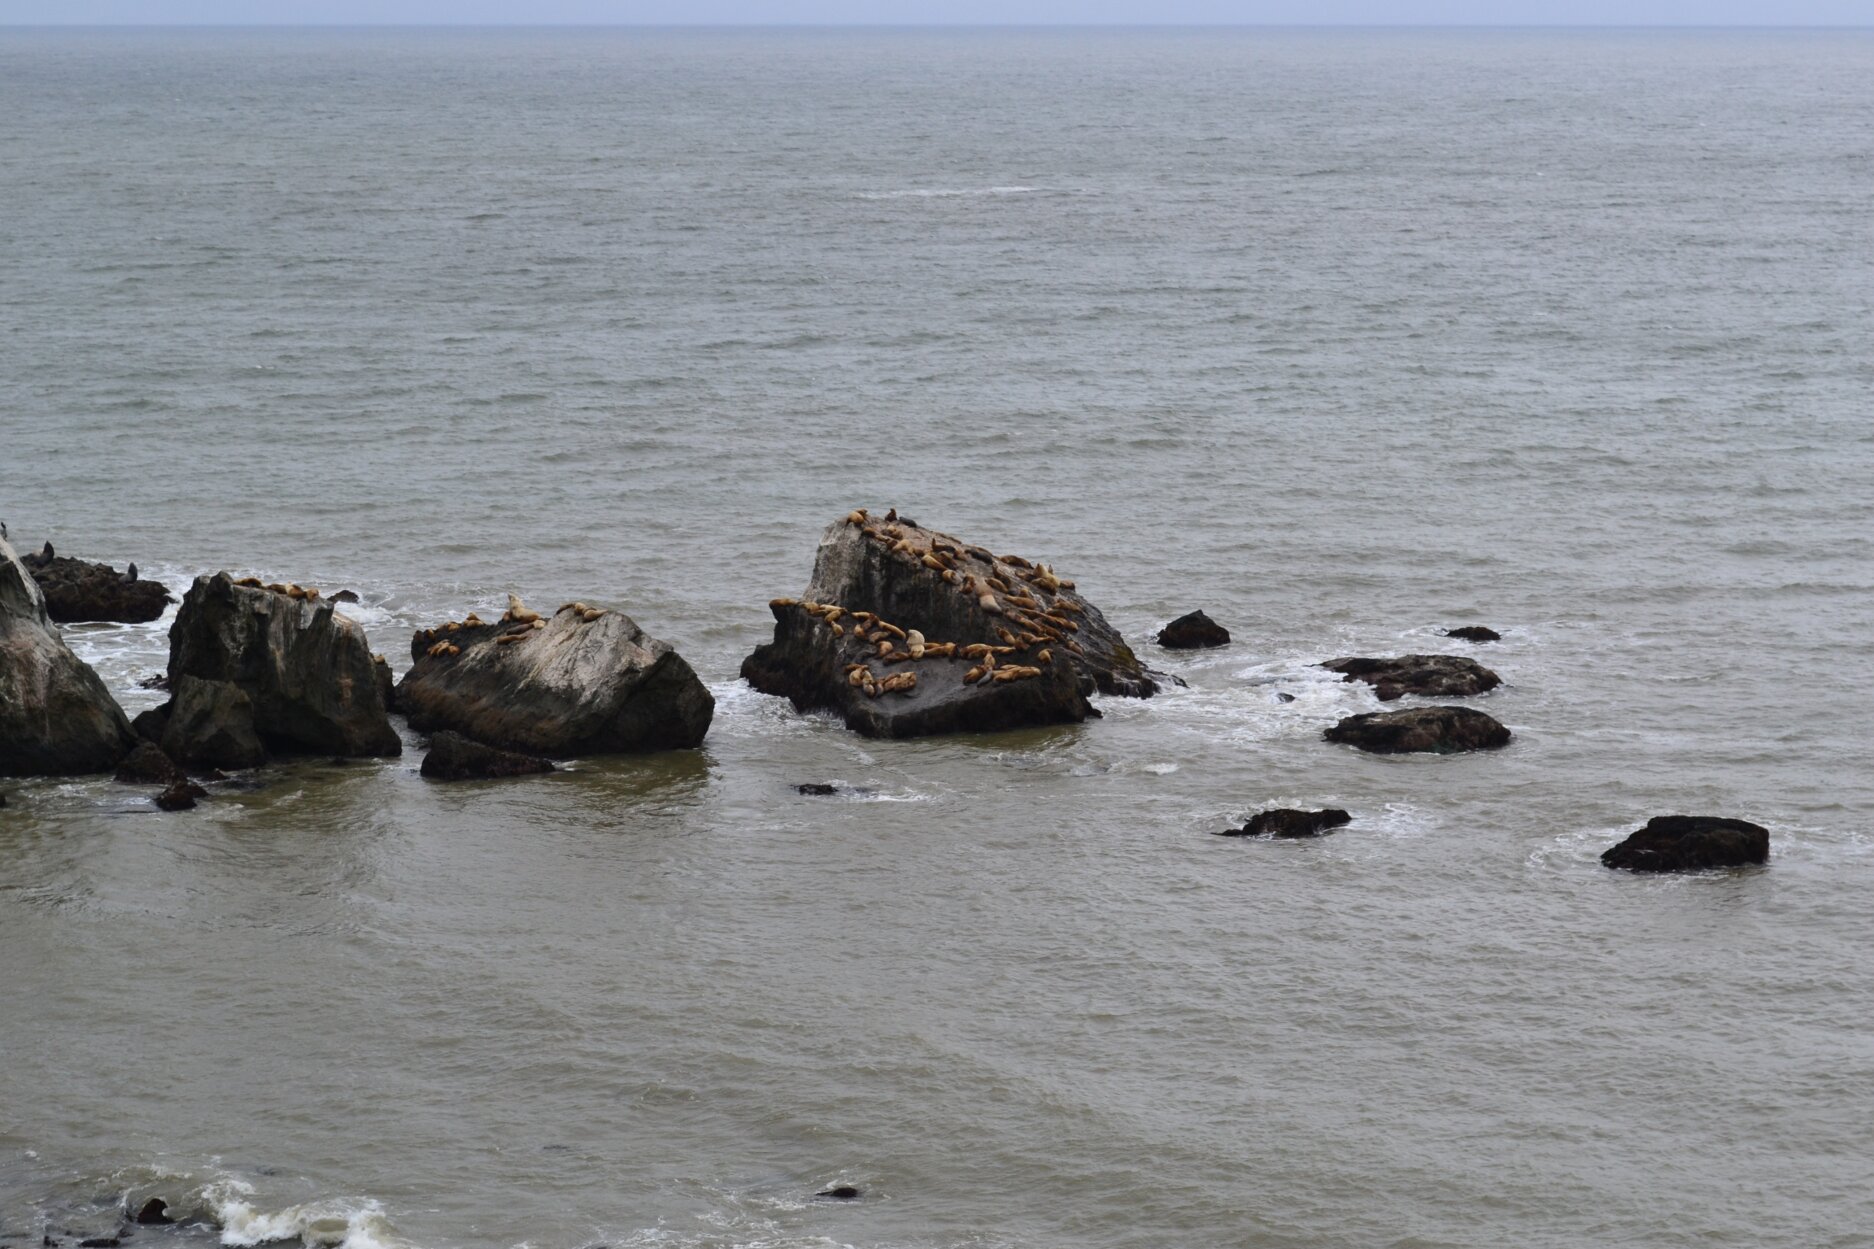
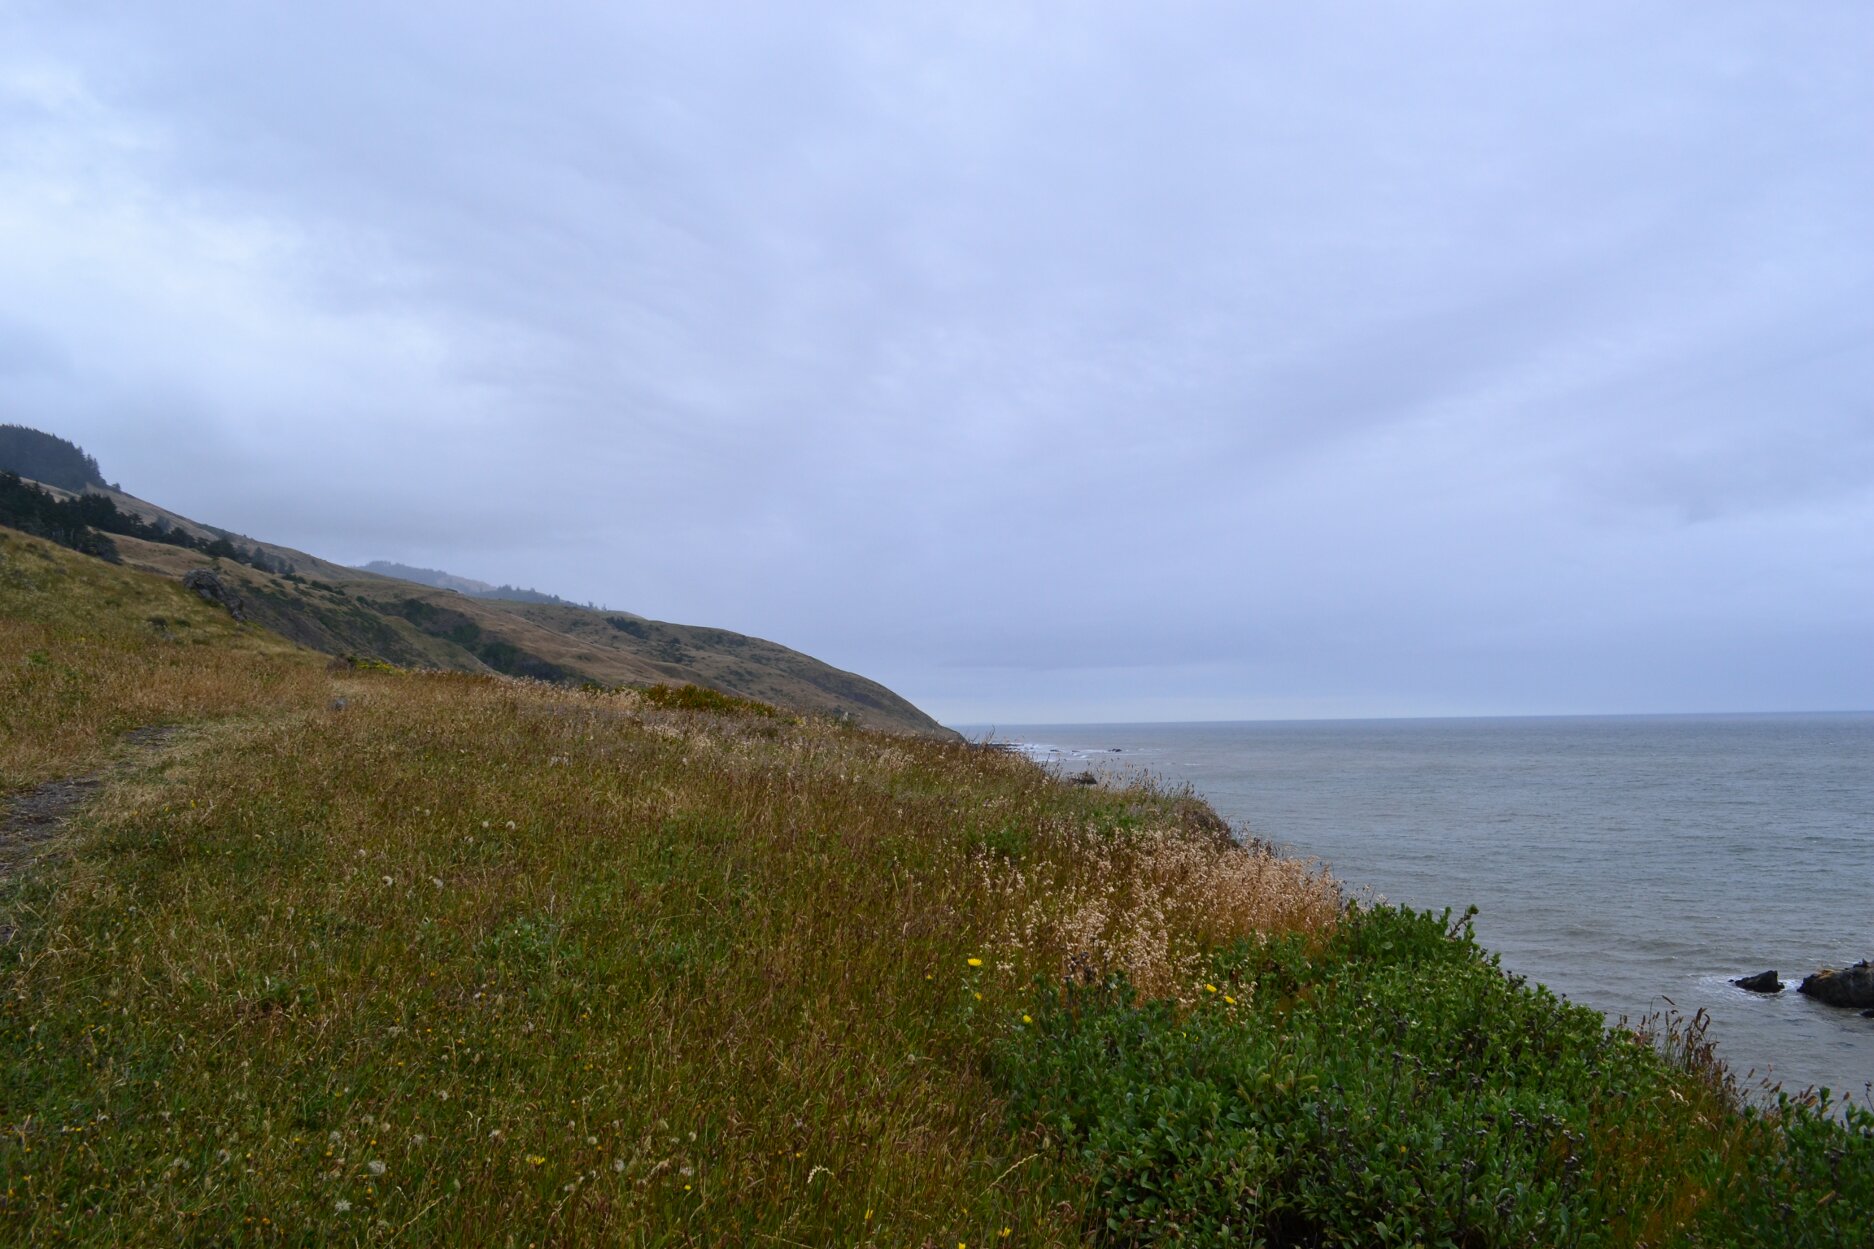
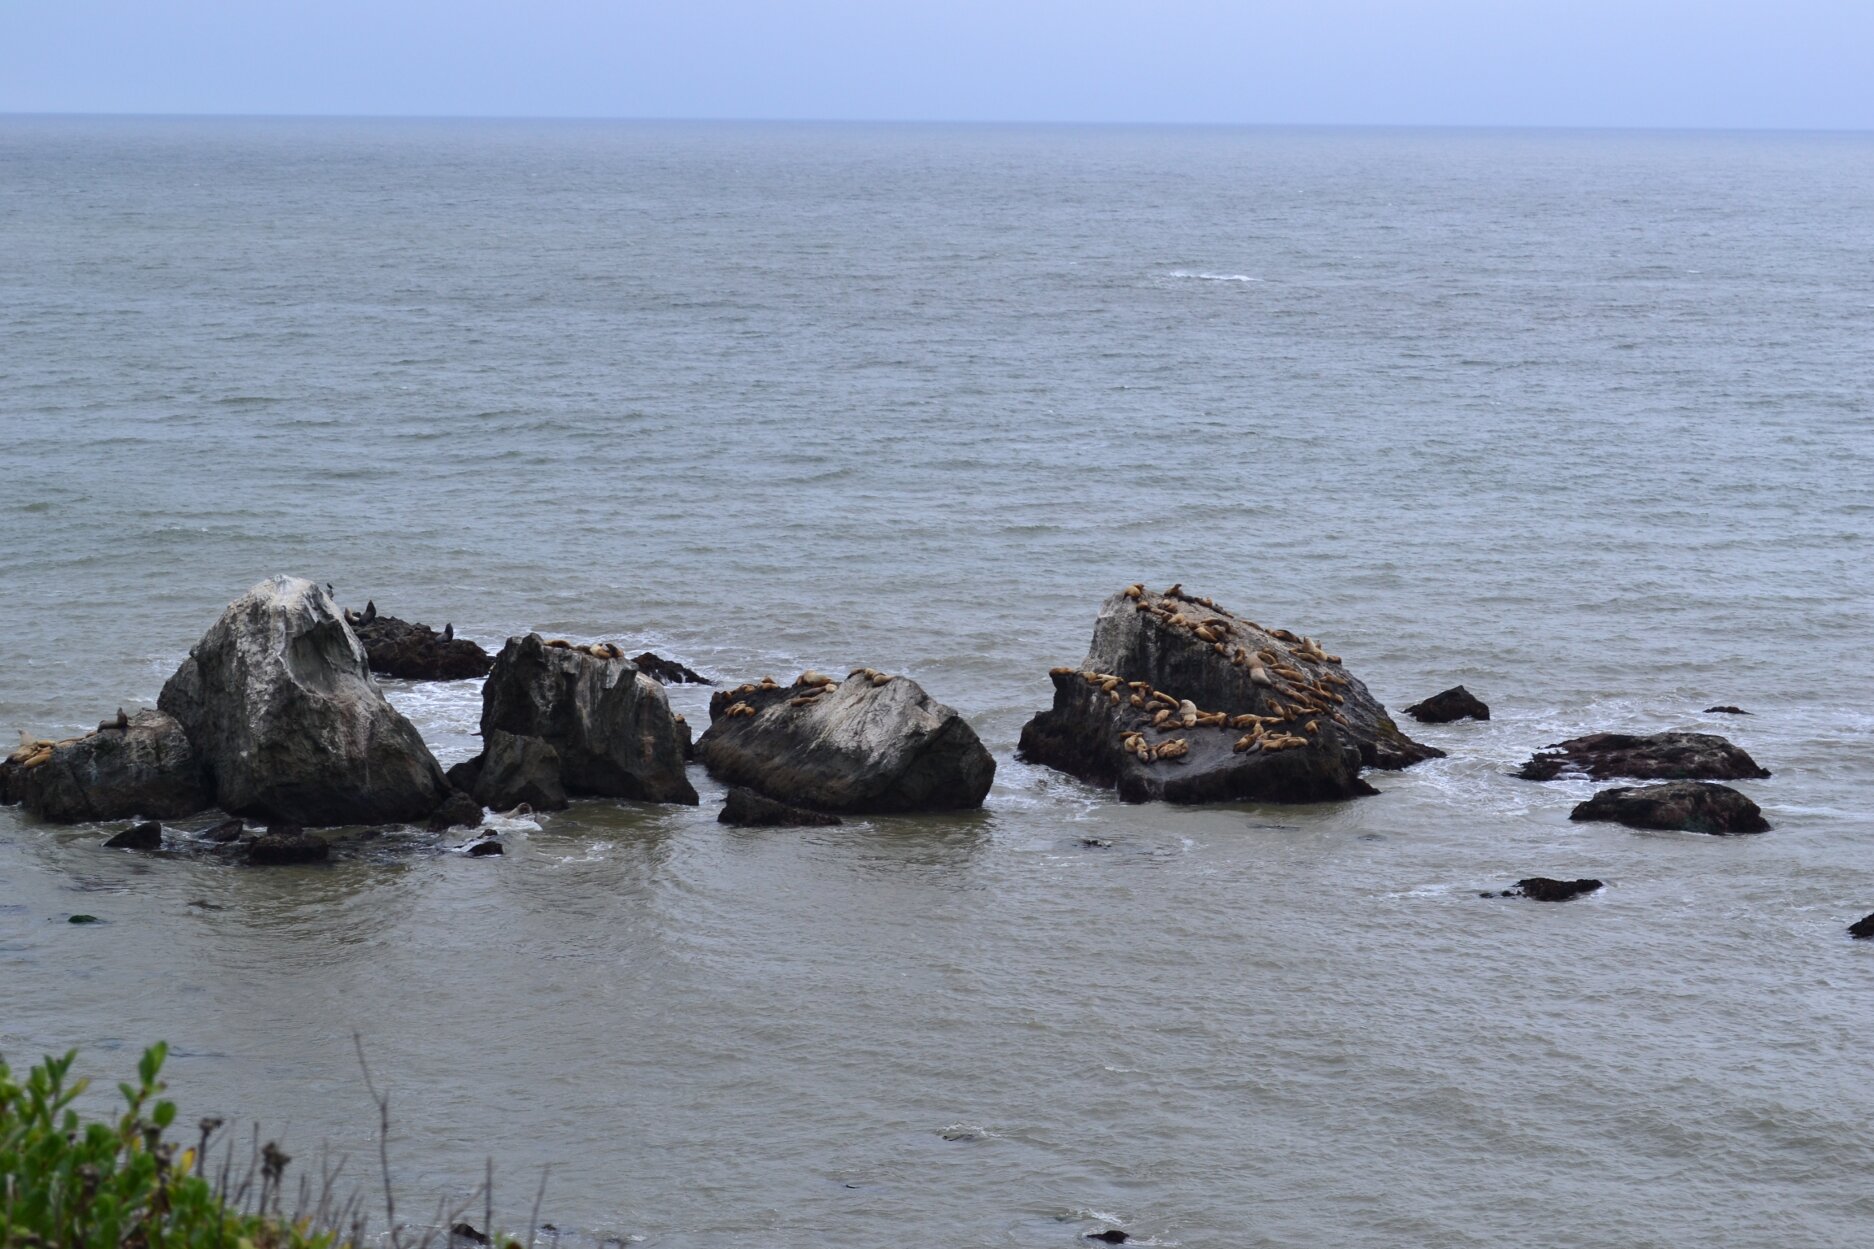
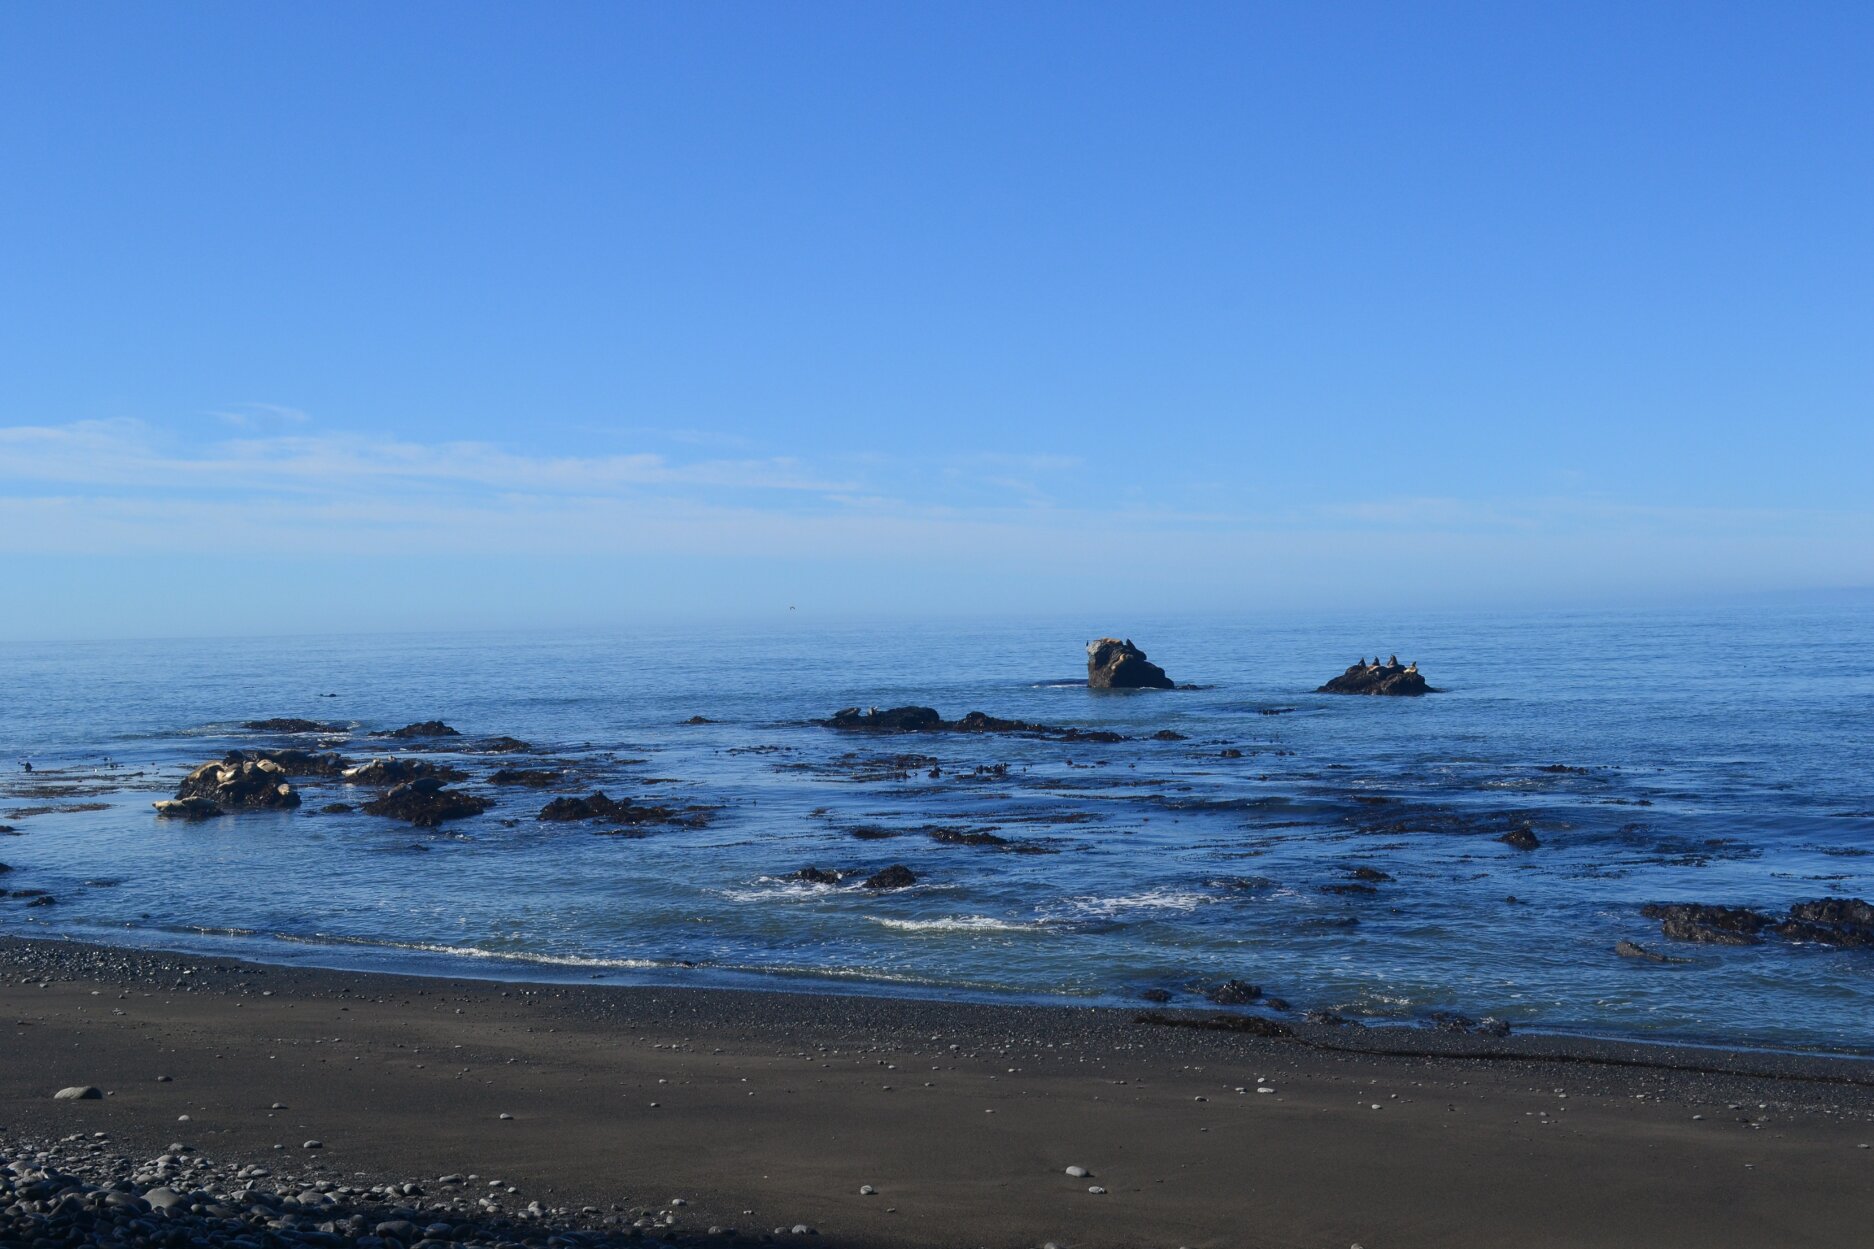
Day two saw a few pics of seals and the wonderfully foot friendly flats that the middle part of the trail brings.

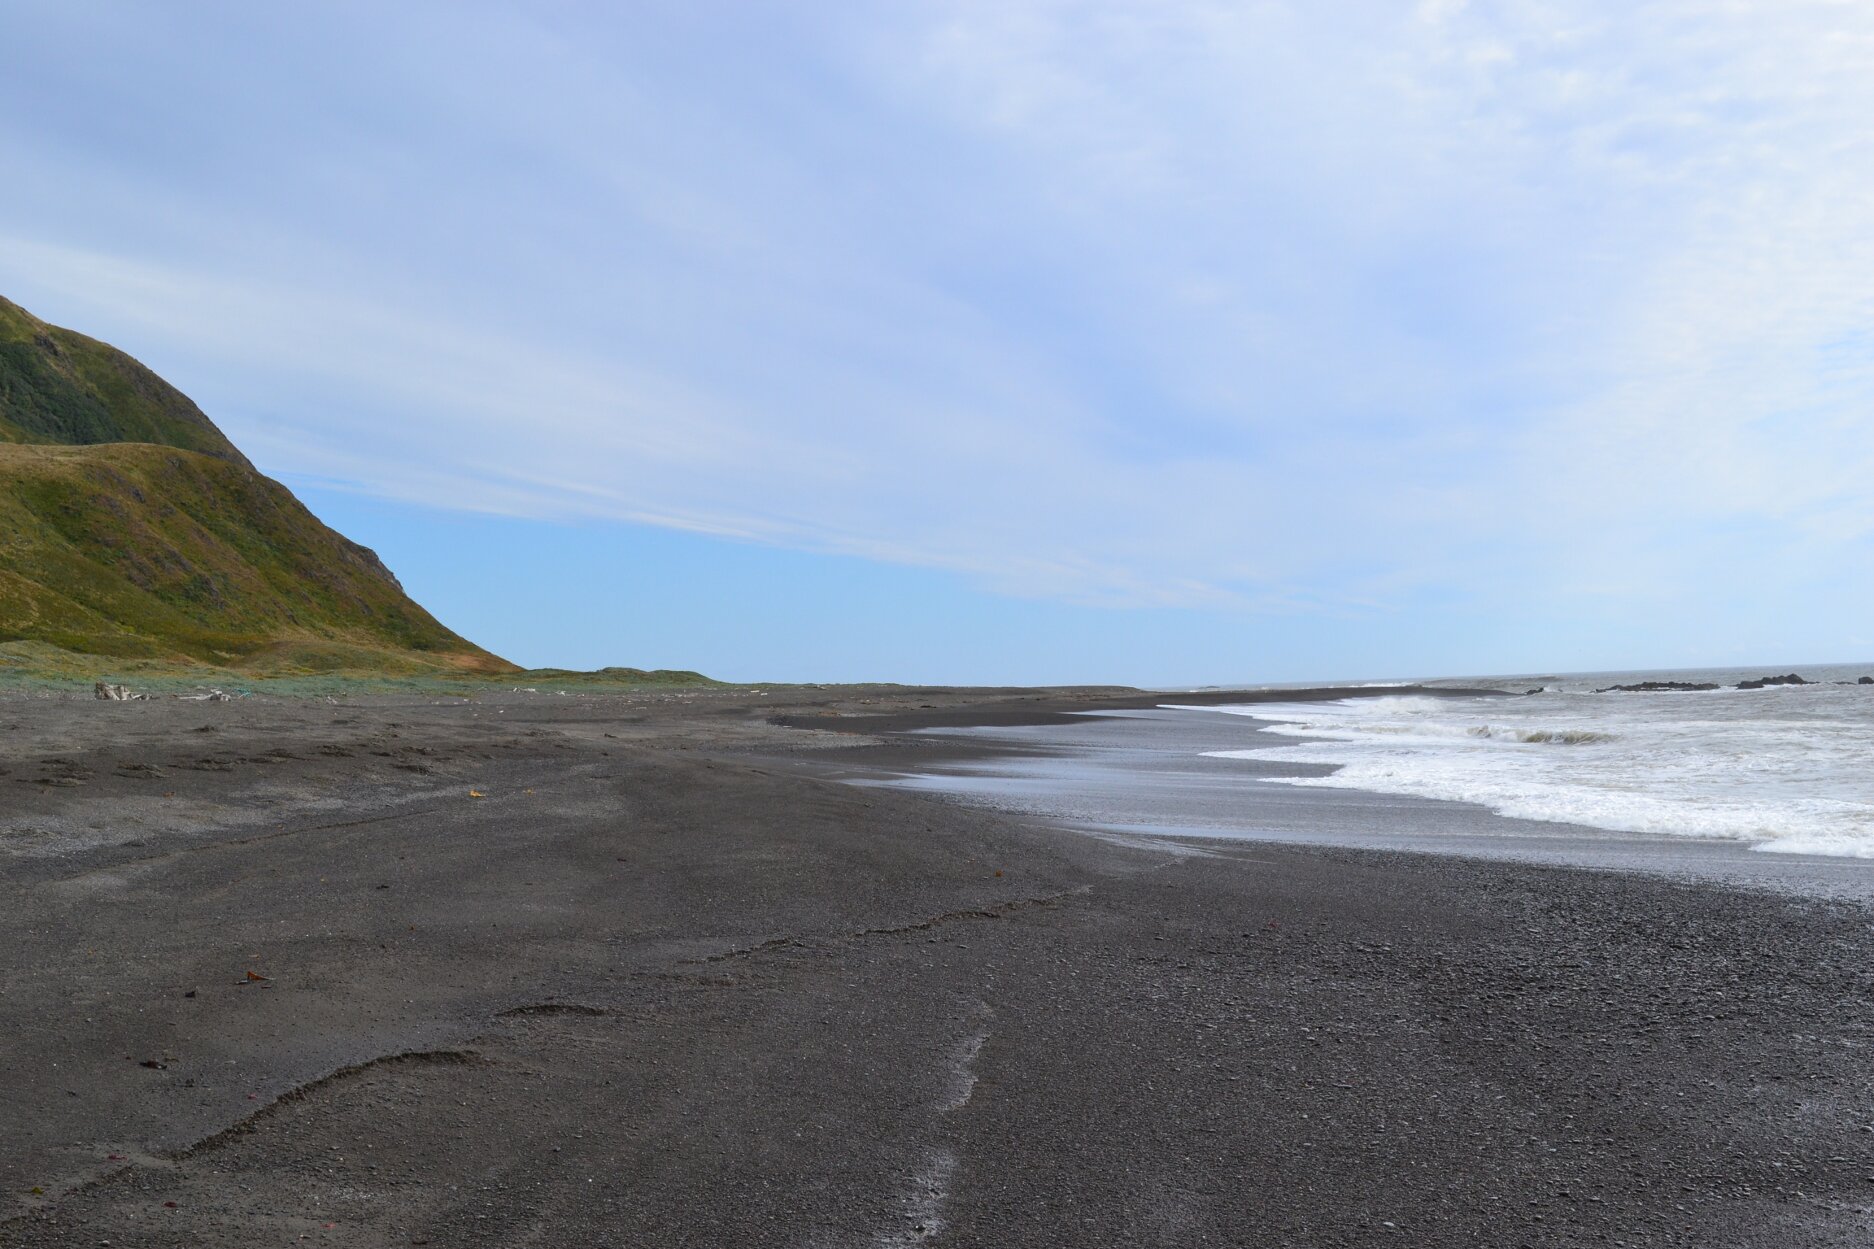
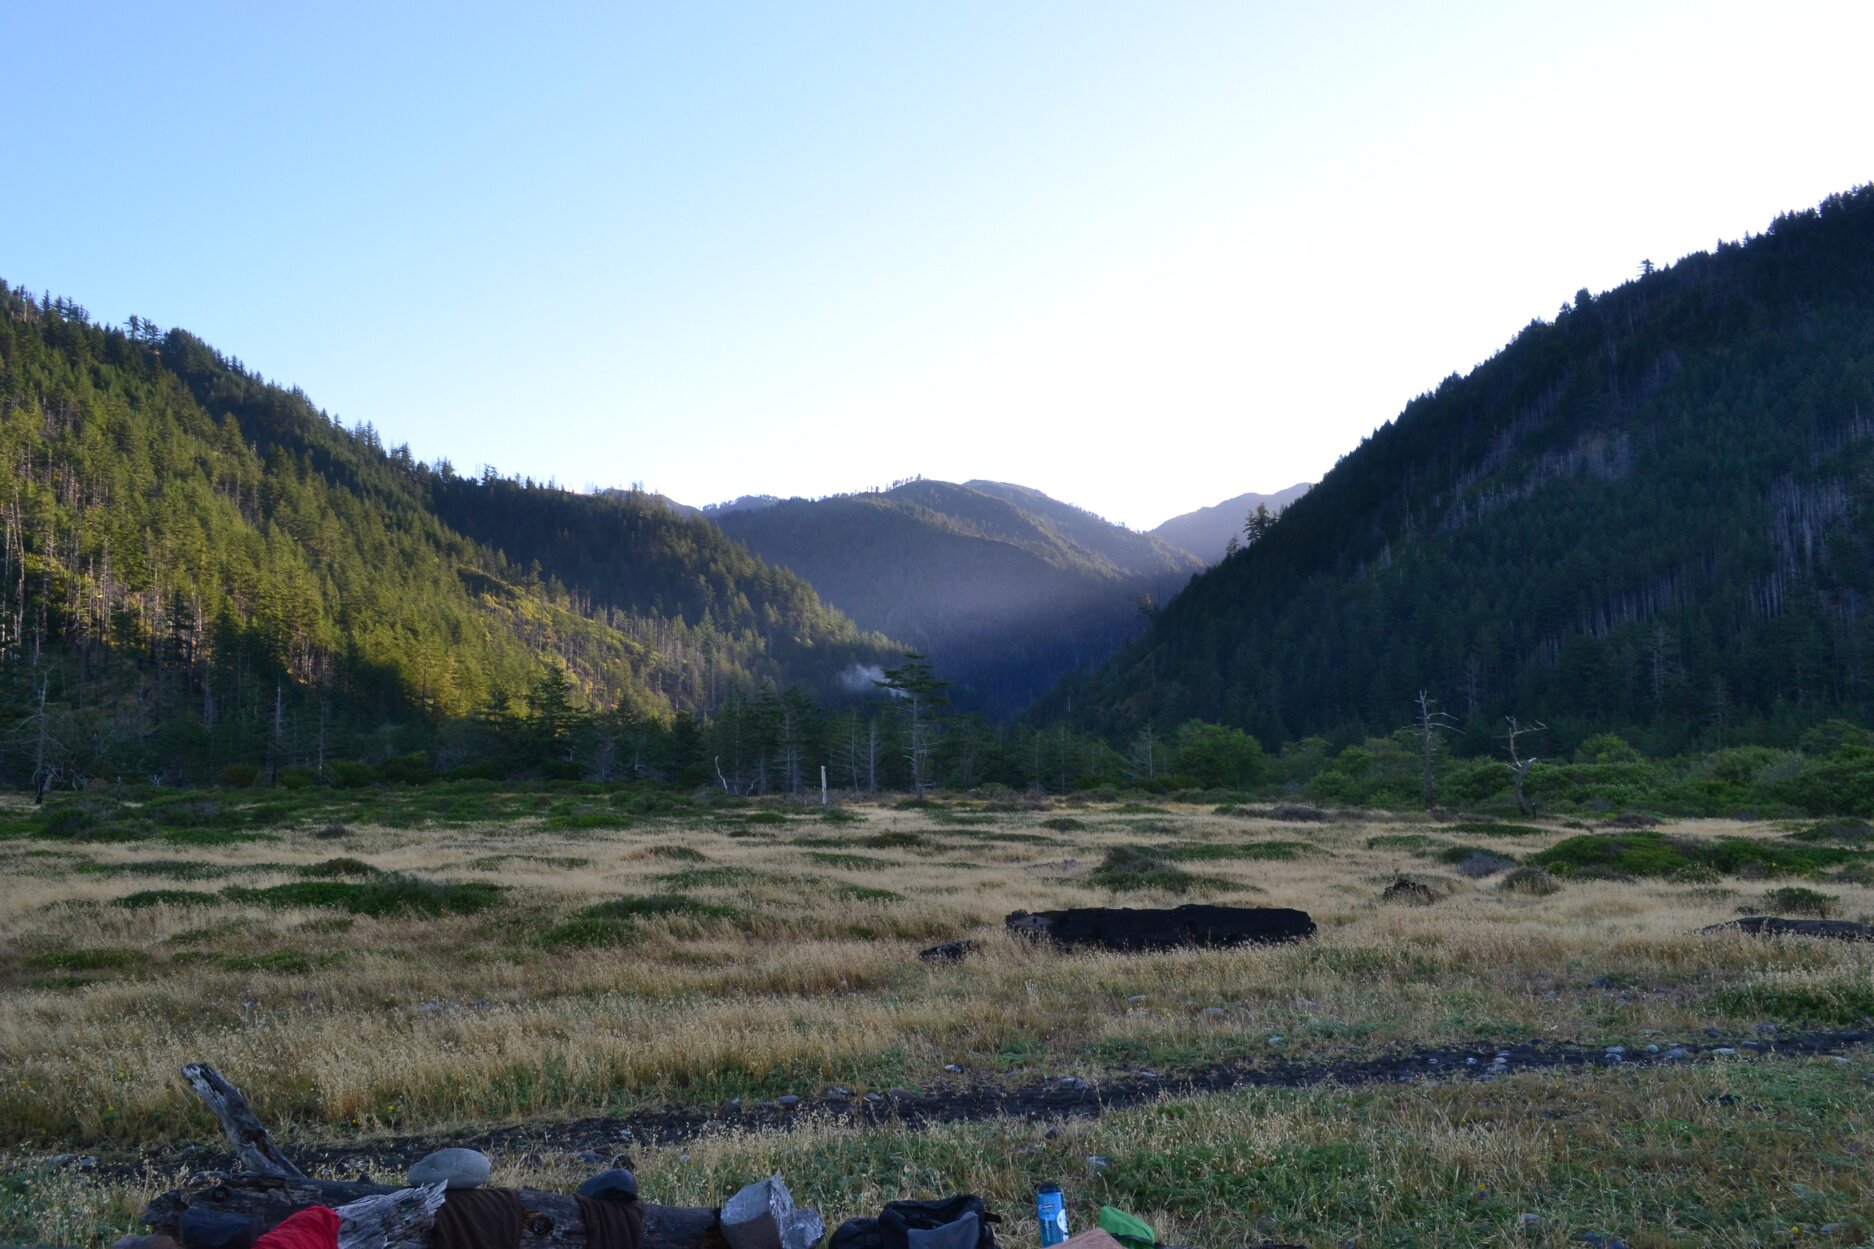
Day three begins with a welcome burst of sunlight peaking through the peaks behind Big Flat where I set camped on night two.

I didn’t get nearly as many pictures as I had hoped.  The rain during day two meant that my camera stayed safely stuffed in my pack.  After loosing a camera last season to an unfortunate tumble into a Colorado lake I wasn’t taking any chances.

Click on an image for a larger version / modal window slide show.

looking north from the overlook at the Black Sands Beach trailheadlooking north from the overlook at the Black Sands Beach trailheadblack sands of the Lost Coast Trail
black sands of the Lost Coast Trail
Posted in The Great Outdoors

National Register of Historic Places Geocoded

The National Park Service website offers a dataset containing a list of all of the 85,000 entries of the National Register of Historic Places along with geopoint information for most all of the entries.  As is frequently the case with data that comes from such sources the data is high quality, but a few steps away from useful in a hacking session using the more common open source tools.

The NPS’s data is available here: http://nrhp.focus.nps.gov/natreg/docs/Download.html#spatial

The dataset comes as a several tables in a Microsoft Access file.  That’s straight forward enough to get moved into a MySQL database.  However, the larger challange was that the geodata was encoded in NAD 27 UTM.

  • UTM = Universal Transverse Mercator – a flavor of geodata encoding that divides the world up into grids on a projection of the earth and references a point as northing and easting within that grid
  • NAD 27 = North American Datum 27 – this is a UTM format that uses a projection made in 1899 and formalized in 1927

To make use of this data I built a few ruby scripts that carry out the conversion between UTM and our standard, loveable lat / lng.

Feel free to use the dataset for any purpose.

All of the data is lumped into one table, but can easily be broken back out if needed.  Of the 85,000 or so entries in the list of historical places, the data from NPS provided geocoding for around 65,000 or so.  Not perfect, but still a good chunk of data.

mysql> describe historic_places;
+-------------+--------------+------+-----+---------+----------------+
| Field       | Type         | Null | Key | Default | Extra          |
+-------------+--------------+------+-----+---------+----------------+
| id          | int(11)      | NO   | PRI | NULL    | auto_increment |
| refnum      | varchar(15)  | YES  |     | NULL    |                |
| resname     | varchar(256) | YES  |     | NULL    |                |
| address     | varchar(256) | YES  |     | NULL    |                |
| city        | varchar(256) | YES  |     | NULL    |                |
| vicinity    | varchar(256) | YES  |     | NULL    |                |
| county      | varchar(256) | YES  |     | NULL    |                |
| state       | varchar(256) | YES  |     | NULL    |                |
| certdate    | varchar(256) | YES  |     | NULL    |                |
| multname    | varchar(256) | YES  |     | NULL    |                |
| acreage     | varchar(256) | YES  |     | NULL    |                |
| utmzone     | varchar(256) | YES  |     | NULL    |                |
| utmeasting  | varchar(256) | YES  |     | NULL    |                |
| utmnorthing | varchar(256) | YES  |     | NULL    |                |
| latitude    | varchar(256) | YES  |     | NULL    |                |
| longitude   | varchar(256) | YES  |     | NULL    |                |
+-------------+--------------+------+-----+---------+----------------+
16 rows in set (0.00 sec)

historic_places.sql.tar.gz (gzipped SQL dump, 4.8 MB)
historic_places_csv.tar.gz (gzipped CSV, 4.8MB)

Posted in dataset, Geekery, Hackery

UTMy: Converting UTM Geodata to Latitude / Longitude

UTM, or Universal Transverse Mercator, encoded geodata seems to be very common in some of the datasets I am playing around with from data.gov.  In order to make that data useful to me and play well with the other data I have gathered I need it in the more standard lat / lng format we web people are used to.

While I found several open source packages that look like they handle UTM data, I didn’t find all that much that was suited to simple conversions.  Thus was born UTMy, a small set of Ruby scripts that convert UTM to Lat / Lng points.

I won’t try and type out a full UTM tutorial as there are several found with a quick search, but one thing that needs to be noted if you are new to it is that there are many different types of UTM.  (insert groan here)

UTM geodata consists of points on a gird of a Mercator projection.  There are lots of different Mercator projections that can be used in this roll, and organizations will often pick one more suited to their needs or specific geography.  Therefore, before using this or any other script to convert your data you will need to know what projection you are dealing with.

UTMy offers support for NAD 27 and NAD 83.  WGS84 is another common format, and it appears to be functionally equivalent to NAD 83 so the scripts should be safe with that data as well.

NAD 27 and NAD 83 are two common flavors of UTM used in North America, and you will frequently find them used in data released by the US Federal Government.  The “27” in NAD 27 refers to a 1927 standard based on a projection calculated in 1866.  Yeah.

Much of the math in UTMy is based on Sami Salkosuo’s excellent article on the IBM website at http://www.ibm.com/developerworks/java/library/j-coordconvert/

UTMy is modular, so other projection systems should be easy to incorporate.  I haven’t added any others because I am not working with any other datasets at the moment.

Its up on Github: https://github.com/mschwar99/UTMy

If you aren’t familiar with Github and are just looking for a download, just look in the upper right hand corner of the page for the download link.

Happy geocoding.

Posted in Geekery, Hackery

Parallel Lines and Google Maps v3

Still working on a mapping project.  A section of the code involves drawing bounding boxes around various points of a Google Map polyline.

Reading up on the geometry involved I came across an excellent demo of the part of the problem domain: drawing parallel lines along a path.

The algorithm is pretty simple:

  • Convert from a LatLng geopoint to a 2 dimensional point on the flat plane of the containing <div>
  • Plot a point above and below the line by matching the slope of the current line and offsetting by a specified width
  • Convert new points back to geopoints
  • When entire line is parsed build two new overlays from the offset points and draw on the map

The demo was built for Google Maps version 2 which, while still functional, is now outdated.  I ported the code over to version 3 of Google Maps.  Links to the ported code are below.  Just like Bill’s original code it is of course free for any use.

Posted in Geekery, Google Maps, Hackery

I grew up in (39.0483284, -95.67803955): Dataset of Geocoded US Cities

I’m working on a mapping project at the moment and have delved into the world of geopoints and GIS.  Joy oh joy.

From my day job I have seen that there is a wealth of free data available at data.gov, but its not always in a form that is immediately usable for an average hacking session.

Example one: http://www.data.gov/geodata/g602088/

The data presented here seems to be of a very high quality:  a list of every populated place in the US, the population (2000 census), and most importantly: a geocoded location.  This is a set of data that a data warehouse would be happy to sell you for a thousand or so dollars.  However, the data is offered for download as a shapefile.

Now don’t get me wrong: shapefiles are completely standard raw materials for GIS professionals and it is a (semi) open format.  For a guy like me that isn’t going to buy a license for ESRI GIS software or delve into PostGIS it is still a step away from what I actually need though.

Enter open source software.

After some Googling I came across a great little set of C scripts called shp2txt.  A small executable built on top of the shplib Open Source C libraries.  These libraries parse the shapefile and harvest the stored data out of the DBase formated datastore that accompanies it.

So for me (open data + open source software) = usable dataset.

One open turn deserves another so here is the resulting dataset that came out of the shapfiles:

cities2.csv.tar.gz — gzipped CSV, 1.2MB
cities2.sql.tar.gz — gzipped SQL dump file, 1.2MB

The dataset contains the following fields:

mysql> describe cities2;
+------------+-------------+------+-----+---------+-------+
| Field      | Type        | Null | Key | Default | Extra |
+------------+-------------+------+-----+---------+-------+
| id         | int(11)     | YES  |     | NULL    |       |
| xcoord     | varchar(15) | YES  |     | NULL    |       |
| ycoord     | varchar(15) | YES  |     | NULL    |       |
| z          | varchar(10) | YES  |     | NULL    |       |
| m          | varchar(10) | YES  |     | NULL    |       |
| citiesx020 | varchar(10) | YES  |     | NULL    |       |
| feature    | varchar(25) | YES  |     | NULL    |       |
| name       | varchar(50) | YES  |     | NULL    |       |
| poprange   | varchar(25) | YES  |     | NULL    |       |
| pop2000    | varchar(15) | YES  |     | NULL    |       |
| fips55     | varchar(10) | YES  |     | NULL    |       |
| county     | varchar(40) | YES  |     | NULL    |       |
| fips       | varchar(40) | YES  |     | NULL    |       |
| state      | varchar(5)  | YES  |     | NULL    |       |
| statefips  | varchar(15) | YES  |     | NULL    |       |
| display    | varchar(10) | YES  |     | NULL    |       |
+------------+-------------+------+-----+---------+-------+
16 rows in set (0.00 sec)

Data attributions:

The original data set was downloaded from data.gov and is not subject to any usage restrictions per the data.gov Data Policy.

You are free to use the derivative SQL and CSV files that I produced for any use.

Posted in dataset, Geekery, Hackery